Using Spectral Irradiance Curves

Here we describe our spectral irradiance curves. Again, we caution you on the need for testing of the final configuration particularly when the “total radiation budget” for the system, source to detector, is tight. In this tutorial, we provide examples of the use of the data. First, we discuss the importance of source size and then describe the intense spectral lines from the arc lamps.

Source Size

Our curves can be very misleading when it comes to selecting a lamp. A quick glance shows the irradiance increasing as we move up in lamp power. More irradiance is not necessarily better; lower power lamps have their advantages.

A lot of applications require re-imaging of the source. The lower power lamps have small radiating areas, arcs or filaments. These are as bright, and in some cases brighter than, the larger arcs or filaments of the higher power lamps. You get as much flux density on target with a small lamp as with a large. If your target (a monochromator slit, fiber, sample, etc.) is small, then you won’t do any better with a larger lamp. Note: the smaller arcs of some of the xenon lamps make them more efficient than either the mercury or QTH lamps, for many applications.

Smaller lamps are easier to operate. They require and produce less total power. In some cases, as with high power lamps, you have to use a liquid filter to get rid of the high power to protect optical components. Apart from damage to optics, a continuously running kW source will heat the laboratory and your equipment. Therefore, it is a good idea to carefully analyze your optical system so that the lowest power lamp that will serve your needs can be selected.

Comparing the 6332 50 W and 6315 1000 W QTH lamps offers an extreme example. From the curves, the kW lamp produces about 20 times the irradiance of the smaller lamp. But, the 6315 has a 6 x 16 mm filament while the 50 W lamp has a 3.3 x 1.6 mm filament. For a small target, several mm in dimension, the re-imaged smaller lamp actually produces significantly more power on target than the re-imaged kW lamp. When you need to irradiate a very large area, the kW lamp is better.

The Spectral Lines from Arc Lamps

The intense UV lines make the mercury lamp the choice for many UV sensitive processes and for excitation of luminescence - particularly when you can efficiently excite with 313, 365, 404 or 436 nm radiation. When you need to scan the wavelength of the excitation source, you may be better off with the smoother xenon lamp spectrum. With the xenon lamp, you have fewer worries about the dynamic and linear range of a detection system. The rapid variation of the mercury lamp output with wavelength also puts demands on wavelength reproducibility in any application where you scan the source and where you ratio or subtract separate resulting scans.

We publish the wavelengths for the lines from our mercury spectral calibration lamps. Some of these lines are extremely narrow while others show structural broadening. The wavelength values of these lines from the low-pressure lamps, and the early alphabetical designation of some of them, are still used as labels for all mercury lines.

i Line h Line g Line e Line
365.01 nm 404.65 nm 435.84 nm 546.07 nm

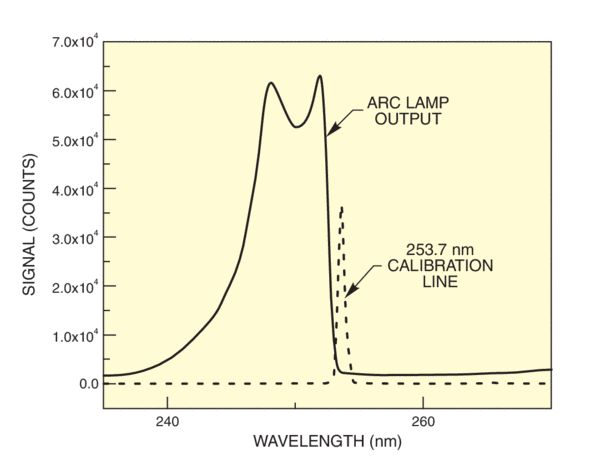
Our irradiance data shows broader lines and some line shifting from these generic values. Doppler broadening and self-reversal cause these changes. Since self-reversal depends on the passage of radiation through colder mercury, the exact spectral profile depends somewhat on the lamp type and envelope temperature. Figure 1 shows that the “254” line, which dominates the output of the 6035 Spectral Calibration Lamp, is substantially absorbed in the 350 W Hg lamp, model 6286 , and in fact we should speak of a 250 nm line. This is important for selection of an interference filter for this and some of the other lines.

“254” nm line from a 350 W Hg arc lamp shown with calibration line. The line width (FWHM) of the calibration line, as recorded by our MS257TM Spectrograph with a 1200 l/mm grating and 50 µm slit and photodiode array, was 0.58 nm, instrument limited
Figure 1. “254” nm line from a 350 W Hg arc lamp shown with calibration line. The line width (FWHM) of the calibration line, as recorded by our MS257TM Spectrograph with a 1200 l/mm grating and 50 µm slit and photodiode array, was 0.58 nm, instrument limited.

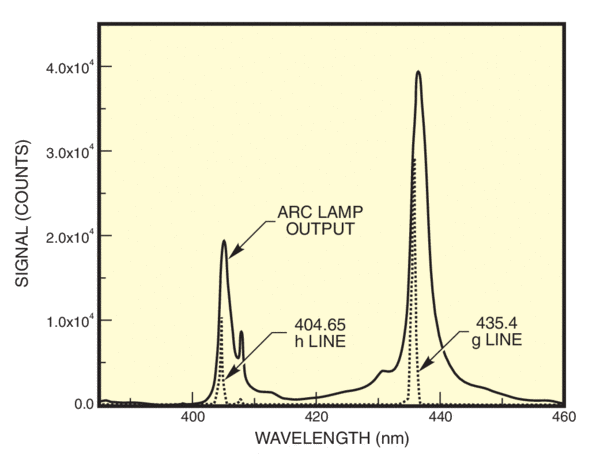
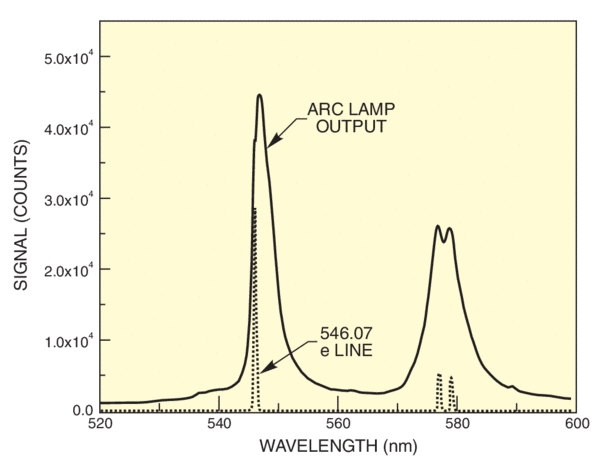
The high resolution scans of Figure 2 and 3 also show the line broadening.

The g and h lines from the 350 W Hg lamp shown with a calibration line recorded on the same equipment. These data were recorded with our MS257TM Spectrograph and a PDA, so the wavelength calibration is exact
Figure 2. The g and h lines from the 350 W Hg lamp shown with a calibration line recorded on the same equipment. These data were recorded with our MS257TM Spectrograph and a PDA, so the wavelength calibration is exact.

For most calculation purposes, the actual line shape is less important than the total irradiance in the band of wavelengths close to the line. This will be the same for a low-resolution scan as for a high-resolution scan. The line shape and height may differ, but the area under the scans is the same to a good approximation.

The green 546.1 nm line and yellow doublet
Figure 3. The green 546.1 nm line and yellow doublet.

Example 1

Calculate the illuminance, in ft candles, 8 ft from the 6285 500 W mercury arc lamp, along the direction of the highest illuminance.

The data on our curves are for the direction of highest irradiance, which is of course the same as that for highest illuminance.

The steps are:

1. Convert the irradiance data to photometric values by multiplying the irradiance curve by the V(λ).

2. Convert the values in lux to values in ft candles.

3. Make the correction for the difference in source-target plane distance, 0.5 m vs. 8 ft in this example.

Step 1

Only visible radiation contributes to photometric value, so we work with the 400 - 750 nm portion of the spectrum. (We magnify this portion of the curve with a photocopier.) We first consider the four major visible lines, essentially cutting them off at a median background level, EB, judged somewhat arbitrarily to be 50 mW m-2 nm -1. We estimate the value at the peak and the line width from the (magnified) curves and tabulate the conversion:

λ (nm) Eλ Estimate of Eλ from Curve (mW m-2 nm-1) Δλ (nm) V(λ) Illuminance Due to Peak Ev (lux)
405 960 3.9 0.0008 2
436 1180 3.9 0.0173 54
546 1190 5 0.98 3983
580 750 8 0.87 3565
Total from Peaks 7604

We have used:

Illuminance in lux, EV = Eλ x Δλ x 683 x V(λ). Note: the dominant contribution of the 546 and 580 nm peaks to the luminous total. The contribution from the background is:

The total illuminance from the peaks and background is about 11260 lux at 0.5 m.

Step 2

Since 1 lux is 1 lumen m-2 and 1 ft candle is 1 lumen ft-2, we divide 11260 by 10.76 to get 1046 ft candles at 0.5 m.

Step 3

At 8 ft, 2.44 m, the value is 1046 x (0.5/2.442)2 = 44 ft candles. (Integrating using our data files for the lamp gives 45 ft candles and we measure 48 ft candles using a photometer.