Introduction to Laser Frequency Stabilization

The steps outlined in this application note can be used to stabilize a TLB-7000, TLB-6900, or TLB-6300 series tunable diode laser to a reference cavity using the Pound-Drever-Hall stabilization technique. For a first attempt at active laser stabilization, it is recommended that one begins with a reference cavity linewidth much broader than the free-running linewidth of the laser. This application note should be considered only as a starting point for laser stabilization, as more advanced servo designs and careful engineering of the reference cavity construction and mounting are required to achieve optimum performance.

Narrow-linewidth continuous-wave (CW) lasers are ubiquitous in atomic, molecular, and optical physics. They have played, and continue to play a major role in advancing precision measurements in many fields of science. The “free-running” linewidth, or short-term stability of the laser, is often not adequate for many applications without active stabilization of the laser frequency. In this application note, we will describe a powerful and elegant technique, used in some of the most challenging precision measurements in modern optics, for controlling and stabilizing the frequency of a CW laser to a high-finesse optical cavity. Precision spectroscopy and the manipulation of atomic and molecular systems have directly benefited from the resulting improvement in CW laser stability over the past several decades. For example, atomic clocks based on optical transitions require extremely stable laser sources to accurately probe the sub-Hertz linewidths available in laser-cooled samples1. Interferometric measurements such as the search for gravitational waves (e.g. LIGO2) also critically depend on the availability of narrow-linewidth laser systems with extremely low frequency and amplitude noise. In the following section, we will describe the main features of a feedback control system used for laser stabilization and emphasize its primary roles. We will then describe in detail the required components and a simple implementation of such a system. The final section will analyze the closed-loop performance of the system.

Feedback Loop Basics

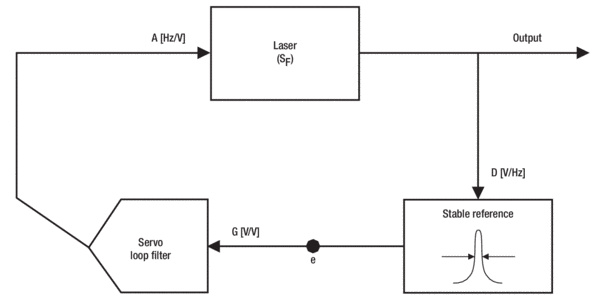
A schematic of a simple feedback loop is shown in Figure 1. The first component in the loop is the laser that is to be stabilized. Part of the output is split off and used in the feedback loop. The noise intrinsic to the laser can be characterized in terms of the linear spectral density of frequency fluctuations, defined as the RMS frequency fluctuations (δνRMS) per square-root unit bandwidth (B): SF(f) = δνRMSB1/2 [Hz ∕ Hz1/2]. The free-running linewidth and noise spectrum of different lasers can vary greatly depending on the stability and finesse of the resonator design, gain-medium characteristics, and other laser parameters. For example, in many solid-state lasers with relatively high-finesse resonators, the spectral density of frequency noise is often dominated by pump and mechanical fluctuations, which generally fall off as ~1/f and can be greatly suppressed by the feedback loop. On the other hand, the dominant frequency/phase noise in many diode laser systems, such as New Focus™ diode lasers, is often of a quantum nature due to larger spontaneous emission rates7, resulting in significant noise processes extending out to higher Fourier frequencies.

Simplified schematic of laser feedback loop
Figure 1. Simplified schematic of laser feedback loop. SF: spectral density of frequency noise; E: error signal point; D: discriminator coefficient; G: loop filter gain; A: actuator coefficient.

To detect fluctuations in the laser frequency, a highly stable reference is needed for comparison. One common way in which this is achieved is by using a high-finesse Fabry-Perot cavity, constructed in such a way as to provide the necessary stability over the time scale of interest. The mth resonant frequency of a Fabry-Perot cavity (νm), determined by the cavity length L as: νm = m (c ∕ 2L), can be extremely sharp when low-loss, high reflecting mirrors are used8. Although mechanical cavities may drift on longer time scales, they can provide very high short-term stability (~ seconds). This stability can be taken advantage of due to a combination of a sharp cavity resonance and a linear response to the incident optical field. Unlike the nonlinear response of atomic transitions that can saturate, the signal from the reference cavity can ideally be increased until the signal-to-noise ratio (SNR) of the detected cavity resonance is sufficient to provide the needed stability for the laser.

To tightly lock the laser frequency to a resonance of the Fabry-Perot cavity, the resonance must be detected quickly and with a high SNR. This is perhaps the most critical part of the feedback loop, as it ultimately determines the performance of the system. The difference between the laser frequency and cavity resonance is converted into a voltage, with a discriminator coefficient D given in units of V/Hz. The discriminator voltage, or “error signal”, can be obtained by several methods. The simplest and most straightforward approach is to lock to the side of the cavity transmission fringe. The side-fringe locking technique uses the slope on either side of the transmission peak to convert frequency fluctuations of the laser into amplitude fluctuations, which are subsequently detected by a photodiode.

Although easy to implement, the technique suffers from several drawbacks. First, amplitude modulation (AM) from the laser directly couples into the error signal; the feedback loop cannot tell the difference between frequency modulation (FM) and AM. Changes in the laser amplitude will therefore be “written” onto the laser frequency. Secondly, due to the photon-lifetime of the Fabry-Perot cavity8, fast frequency fluctuations of the laser will not be detected in transmission through the cavity. A final limitation is the narrow locking range. A small deviation from the locking point can cause the laser to unlock if the frequency momentarily shifts across the cavity transmission peak. The last two limitations present a particularly troubling tradeoff; high-finesse cavities are desirable so as to provide a narrow linewidth for laser stabilization, yet will simultaneously limit the bandwidth of the feedback loop and reliability of the lock9.

A better method, “Pound-Drever-Hall” (PDH) stabilization, is easy to implement and avoids all the above-mentioned complications9. PDH stabilization is closely related to the powerful technique of modulation-spectroscopy used for the sensitive detection of atomic and molecular transitions10. Pound11 first proposed this technique for the stabilization of microwave oscillators by introducing phase modulation at a frequency several times greater than the resonance linewidth. To avoid the limitations of AM on the laser beam, PDH stabilization relies on the rapid modulation of a laser's frequency to quickly probe both sides of the cavity resonance. If the resonance information is detected at a sufficiently high modulation frequency, amplitude fluctuations can be reduced to their shot-noise limited level. In addition, PDH stabilization utilizes the light reflected from the Fabry-Perot cavity. This is advantageous since the reflected light will be at a minimum on resonance decoupling AM noise from the error signal. Another important aspect of the PDH technique is that the response will not be limited by the cavity lifetime, allowing for greater bandwidth in the feedback loop. In the next section, we will describe the details of this technique and its simple implementation.

Once the error signal (e) is generated, it is sent through the servo “loop filter” to ensure the feedback is applied to the laser with the appropriate phase. Due to the finite time delay in the feedback loop, all Fourier frequencies of the error signal cannot be sent back to the laser with the proper phase. The frequency-dependent voltage gain (G, with units of V/V) must therefore roll off toward zero at some frequency to prevent positive feedback. After the signal is conditioned by the loop filter, the correction voltage is finally applied to the actuator, characterized by a coefficient A in units of Hz/V. The frequency range over which the actuator exhibits a flat frequency response to the applied correction signal usually determines the maximum bandwidth of the servo loop. For instance, a piezo-mounted cavity mirror can be used as an actuator to correct the laser frequency. These often have a resonant frequency on the order of a few kHz. Thus the servo bandwidth needs to remain much less than this in order not to excite the piezo resonance. New Focus TLB-7000, TLB-6000 and TLB-6300 series lasers provide convenient inputs for linear frequency tuning up to several kHz. With appropriate servo designs, these can be used simultaneously to provide extremely fast laser-frequency corrections5.

Pound-Drever-Hall Laser Frequency Stabilization

Experimental Setup and Conceptual Model

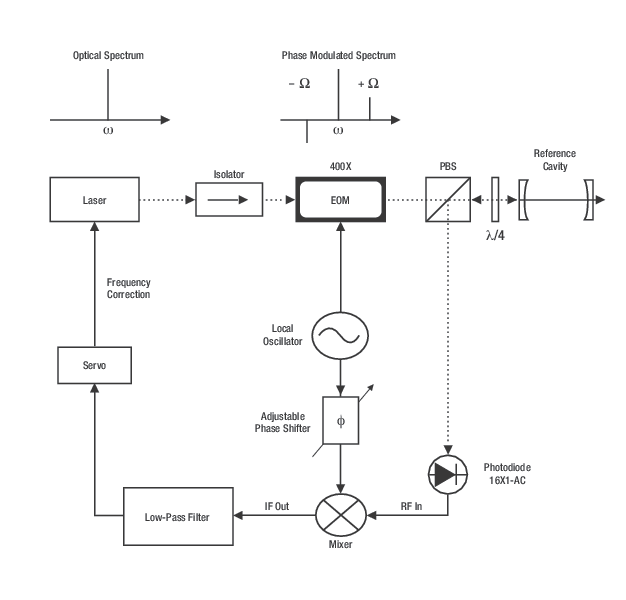
The New Focus™ StableWave™, Velocity™ and Vortex™ series lasers offer narrow instantaneous linewidths. They are well suited for precision spectroscopy and can be easily stabilized to a high-finesse cavity using the PDH locking technique. Many of the critical components needed for PDH laser stabilization are also available from New Focus. An experimental layout to implement PDH laser frequency stabilization is shown in Figure 2.

Schematic of experimental layout for PDH laser frequency stabilization
Figure 2. Experimental layout for PDH laser frequency stabilization. EOM: electro-optic modulator; PBS: polarizing beamsplitter; λ/4: quarter-wave plate.

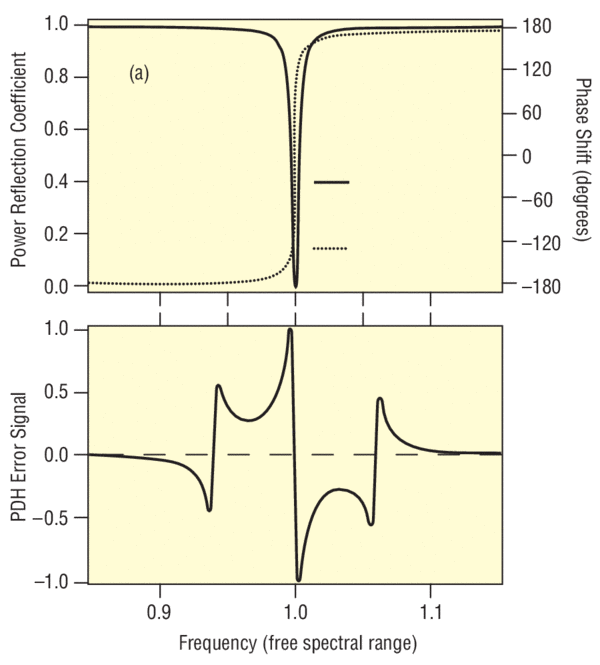
To eliminate back-reflections from coupling into the laser cavity, an optical isolator should be used after the laser. For fast phase modulation of the laser, a New Focus electro-optic phase modulator (Model 4001 or 4003) can be used along with the driver Model 3363. These modulators offer a very pure phase frequency modulation of the laser beam with minimal residual amplitude modulation (RAM)12. (For more information on frequency/phase modulation, see Application Note 2: Practical Uses and Applications of Electro-Optic Modulators.) Keep in mind unwanted amplitude modulation on the optical beam present at the same frequency at which the laser phase/frequency is being swept will corrupt the detected error signal and lead to a potentially unstable offset when locking to the cavity resonance13. After passing through the modulator, the laser beam is spatially mode-matched to a high-finesse Fabry-Perot reference cavity. Light reflected from the cavity is detected on a low-noise photodiode (e.g., New Focus Model 16X1-AC). A polarizing beamsplitter followed by a quarter-wave plate separates the light reflected by the cavity from the incident light. Figure 3(a) shows the power reflection coefficient of the cavity as a function of laser frequency, expressed in units of the cavity free spectral range for a cavity with a finesse of ~160.

Power reflection coefficient and phase shift on reflection vs. laser frequency for Fabry-Perot cavity with finesse of ~160
Figure 3. (a) Power reflection coefficient and phase shift on reflection vs. laser frequency for Fabry-Perot cavity with finesse of ~160. Frequency scale is in units of the free spectral range. (b) PDH error signal vs. laser frequency for modulation frequency Ω = 6% of free spectral range.

Before mentioning the remaining components of the setup in Figure 2, we will discuss how the photodiode signal provides information on the laser frequency fluctuations, giving a conceptual model for the PDH frequency stabilization technique9. The phase modulator sweeps the phase of the laser carrier at a frequency much higher than the linewidth of the cavity resonance. This phase modulation produces FM sidebands on the laser carrier, which are spaced from the carrier by the frequency of modulation, Ω. Since they are well outside the cavity resonance, they are directly reflected from the reference cavity input mirror with no significant phase shift. When the laser carrier frequency is matched to a cavity resonance, the light reflected from the cavity at the carrier frequency will be in phase with the incident light. Detection of the reflected carrier and sidebands by the photodiode yields two heterodyne beats at the frequency of phase modulation, Ω, resulting from the beat between the carrier and each sideband. On resonance, these two beats will be 180º out of phase with respect to each other due to the nature of FM. Therefore the two beats will exactly cancel and there will be no photodiode signal at the frequency of modulation.

When the laser frequency deviates from the cavity resonance, the reflected light at the carrier frequency experiences a phase shift, the sign of which is determined by the direction of the frequency deviation [Figure 3(a)]. The two heterodyne beats produced by the photodiode no longer cancel since they are not exactly 180º out of phase. Therefore, detection of the amplitude of the beat signal at Ω provides an error signal that can be used to correct the laser frequency. Figure 2 shows how the amplitude of the beat is extracted by frequency-mixing the photodiode output with the signal at frequency Ω that drives the phase modulator. A phase shifter is used between the modulation signal source and the mixer to ensure the mixer inputs have the proper phase relationship. Using a low-pass filter to isolate the DC term from the mixer output provides the error signal that is applied to the actuator for laser-frequency correction, after appropriate conditioning.

As the laser frequency is swept through the cavity resonance, the phase shifter should be adjusted to match the error signal to that shown in Figure 3(b). This figure is obtained with a modulation frequency Ω equivalent to 6% of the cavity free spectral range. The appendix provides a more detailed analysis of the PDH technique, revealing in detail how the amplitude of the photodiode signal at frequency Ω provides information on laser frequency fluctuations.

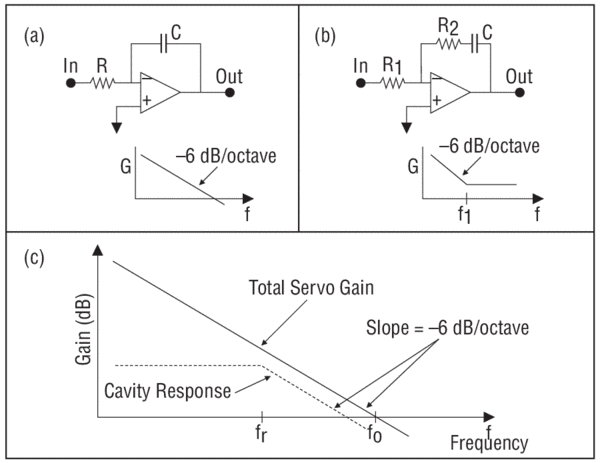
An important feature of the PDH error signal is its broadband response. The dashed line in Figure 4(c) illustrates the log magnitude of the cavity response versus Fourier frequency (Bode Plot). At low Fourier frequencies, the error signal response is constant over frequency. For frequencies beyond the half-width-half-maximum (HWHM) of the cavity resonance, there is a smooth –6 dB/octave roll-off of the cavity response function vs. Fourier frequency. The reason for this change in the cavity response function is due to the storage time of the reference cavity. The phase of the reflected light at the carrier frequency represents a time-average of the incident laser phase and frequency. Since the directly reflected sidebands do not experience a phase shift from the cavity, the heterodyne beat between the reflected sidebands and the carrier is sensitive to fast fluctuations of the laser phase, allowing the laser to effectively be phase-locked to a time-average of itself. It is this ability of the PDH locking technique to provide corrections for frequency fluctuations over a broad bandwidth that makes it powerful for laser frequency stabilization.

Useful circuits for the servo loop filter and their corresponding frequency responses
Figure 4. (a) and (b) Useful circuits for the servo loop filter and their corresponding frequency responses. (c) An example of the total servo gain for a stable feedback control loop (solid line), shown on a log-log scale, and the frequency response of the reference cavity (dashed line). fr corresponds to the HWHM of the reference cavity resonance.

Feedback Loop: Loop Filter and Actuator

Once a good error signal is obtained, all that remains is to send this signal through the servo loop filter and back to the laser's actuator to “close the loop”. As discussed previously, the role of the loop filter is to adjust the error signal such that it is applied to the laser with the appropriate amplitude, phase, and frequency response. To prevent the phase of the error signal from shifting too quickly, resulting in positive feedback, it is important that the gain for the overall feedback loop has a slope of less than 9 dB/octave at the unity gain frequency (fo)14. The value of the unity gain frequency will depend on the overall loop gain, given by: Gtotal= DGA. Figure 4(c) shows an example of a Bode plot for the overall gain of a stable feedback control loop (solid line). Figures 4(a) and 4(b) show two examples of useful circuits often found in the servo loop filter along with their individual frequency responses. If the bandwidth of the feedback loop is much less than the cavity roll-off frequency fr (i.e. fo << fr), the simple integrator circuit in Figure 4(a) is all that is needed to provide a stable overall response function for the loop. If fo > fr, the circuit of Figure 4(b) can be used to turn off the integral gain at a frequency when the response of the reference cavity begins to roll off (i.e. set f1fr). In both cases, the total servo gain will look like that shown by the solid line in Figure 4(c). More sophisticated response functions can be implemented to improve performance, especially to provide increased gain at lower frequencies15.

Performance Analysis

The ability of the servo electronics to track frequency fluctuations and keep the laser tightly locked to the cavity resonance can be estimated by analysis of the closed loop error signal: δeRMS = δνRMSD (see Figure 1). Fourier analysis of this signal can reveal how well the feedback loop is suppressing detected fluctuations at various Fourier frequencies. The free-running noise spectrum will vary depending on the laser system, but one source of noise common to most systems, “1/f noise,” generally falls off as the inverse of the Fourier frequency to some power p. The bandwidth of the feedback loop must therefore be high enough such that the servo gain will match or exceed the rise of this noise at lower frequencies.

The in-loop analysis alone cannot be used to determine the absolute stability or linewidth of the laser. This is because analysis at this point cannot distinguish between real fluctuations of the laser frequency and noise present in the discriminator itself. For example, if the resonance of the reference cavity is changing due to slow thermal expansion or small vibrations of the cavity length, the feedback loop will write these fluctuations onto the real output of the laser. Monitoring the error signal voltage gives a good indication of the performance of the feedback-loop electronics, but an independently stabilized laser system is needed to quantify the absolute stability or linewidth of the laser.

As an example, let us suppose the error signal voltage e is monitored while the laser is locked to the cavity resonance. Measurement of the RMS voltage at this point (δeRMS, over a bandwidth determined by the range of the voltage meter) can be converted into an RMS frequency fluctuation of the laser using the measured actuator coefficient: δνRMS = δeRMS ∕ D. If a 10 mV signal is measured at e for a given discriminator coefficient of = 1 V/MHz, one knows the servo electronics are able to keep the laser locked to within 10 kHz (RMS) of the cavity resonance.


References

  1.  
    1. B. C. Young, F. C. Cruz, W. M. Itano, and J. C. Bergquist, “Visible Lasers with Subhertz Linewidths,” Phys. Rev. Lett. 82, 3799 (1999).
    2. http://www.ligo.org/
    3. For a more detailed discussion of laser stabilization as a problem of control theory, see Refs. 4, 5, and 6.
    4. J. L. Hall, “Stabilizing lasers for applications in quantum optics,” in Quantum Optics IV, J. D. Harvey and D. F. Walls, eds. Springer Verlag: Proceedings of the Fourth International Conference, Hamilton NZ, 1986.
    5. J. L. Hall, M. S. Taubman, and J. Ye, “Laser Stabilization,” in Handbook of Optics: Fiber Optics and Nonlinear Optics, Vol. 4, M. Bass, J. M. Enoch, E. W. V. Stryland, and W. L. Wolfe, eds. (McGraw-Hill, New York, 2001), p. 27.1.
    6. T. Day, E. K. Gustafson, and R. L. Byer, “Sub-Hertz Relative Frequency Stabilization of Two-Diode Laser-Pumped Nd:YAG Lasers Locked to a Fabry-Perot Interferometer,” IEEE J. Quan. Elec. 28, 1106 (1992).
    7. C. E. Wieman and L. Hollberg, “Using diode lasers for atomic physics,” Rev. Sci. Instrum. 62, 1 (1991).
    8. E. Hecht, Optics (Addison-Wesley, Reading, Mass., 1998).
    9. R. W. P. Drever, J. L. Hall, F. V. Kowalski, J. Hough, G. M. Ford, A. J. Munley, and H. Ward, “Laser Phase and Frequency Stabilization Using an Optical Resonator,” Appl. Phys. B 31, 97 (1983).
    10. See for example, New Focus Application Note #7 and references therein.
    11. 1R. V. Pound, “Electronic frequency stabilization of microwave oscillators,” Rev. Sci. Instrum. 17, 490 (1946).
    12. See New Focus Application Note #2.
    13. Ch. Salomon, D. Hils, and J.L. Hall, “Laser stabilization at the millihertz level,” J. Opt. Soc. Am. B 5, 1576 (1988).
    14. G. Franklin, J. D. Powell, and A. Emami-Naeini, Feedback control of dynamic systems, (Menlo Park: Addison-Wesley Publishing, 1988).
    15. J. Helmcke, S. A. Lee, and J. L. Hall, “Dye laser spectrometer for ultrahigh spectral resolution: design and performance,” Appl. Opt. 21, 1686 (1982).
    16. More in-depth descriptions can be found in other review articles, e.g. E. D. Black, “An Introduction to Pound-Drever-Hall laser frequency stabilization,” Am. J. Phys. 69, 79 (2001).

Appendix

Mathematical Treatment of PDH Stabilization Technique

To provide a more concrete understanding of the origin of the error signal for the PDH laser stabilization technique, we present here a brief mathematical derivation of this error signal16. First, consider the interaction of the laser light field with the Fabry-Perot cavity. The light field incident on the cavity at the laser carrier frequency, ω, can be written as Einc = Ei eiωt. The net reflected field from the cavity is Eref = Er eiωt, where Er is related to Ei by the cavity reflection coefficient

r1 and r2 are the field reflection coefficients for the input and output mirrors of the cavity, respectively, T1 is the power transmission coefficient for the input mirror, and FSR denotes the free spectral range of the cavity. Figure 3(a) shows the power reflection coefficient of the cavity, |F|2, plotted versus frequency in units of the free spectral range.

Now consider the effect of the phase modulation on the light field. In the presence of phase modulation at frequency Ω, with a depth of modulation β, the field incident on the cavity becomes Einc = Ei ei(ωt+βsinΩt). This can be expanded using Bessel functions, to:

This expression supports our earlier description of the modulation creating sidebands separated from the carrier by the frequency of modulation, Ω. The reference cavity will affect each frequency independently, and we can write the reflected field in the presence of modulation as:

Since the photodiode response is proportional to the power in the reflected beam, we must now compute |Eref|2. The photodiode output will be filtered to select only the signal at frequency Ω, since it is this portion of the output that samples the phase of the reflected carrier. Dropping all terms not oscillating at Ω leaves us with:

There are two terms remaining in the photodiode output, but we will see that only one of these terms is important. The key difference between the PDH method of laser stabilization and other FM methods is the use of a high modulation frequency. As discussed previously, conceptually this avoids the limitation of the cavity storage time on how quickly phase fluctuations of the laser can be detected. In the current context a high modulation frequency produces sidebands that are well outside the cavity resonance, allowing us to approximate F (ω±Ω)≈-1. Therefore,

With this term being purely imaginary, the cos(Ωt) term in equation 1 vanishes. As described earlier, the photodiode output is mixed with the modulation signal to extract the term amplitude modulating the sin(Ωt) term, providing an error signal e we can use to correct the laser frequency. We can see that

which is plotted in Figure 3(b) for modulation frequency Ω equivalent to 6% of the free spectral range.