Sorry, this family of products is no longer available.

Two-Dimensional Spectrometer
Two-Dimensional Spectrometer
Newport’s Two-Dimensional Spectrometer (2DSpec) is a state-of-the-art instrument for two-dimensional femtosecond spectroscopy. 2DSpec incorporates Newport's highest quality optics, opto-mechanics, spectrometer, vibration control, delay-line stage, and easy-to-use LabVIEW™ based software to deliver high quality results with consistency. Due to the flexible configuration and layout, 2DSpec can also easily be used for acquiring low noise femtosecond transient absorption spectra and can adapt to perform several other ultrafast spectroscopy techniques.
- Flexibly designed two-dimensional femtosecond spectrometer that can also perform transient absorption measurements.
- Supports a variety of ultrafast amplifiers and optical parametric amplifiers (OPA or NOPA) as input
- Pump-probe (collinear) geometry for absorptive line shape and multi-color support
- Control of pump-pump delay range and phase with the touch of a button. Supports phase cycling and rotating frame.
- Robust, stable device is factory assembled and aligned for easy integration. Worldwide installation and support. See All Features
Features
Spectrum Analysis Along Two Energy Axes
In comparison to traditional one-dimensional spectroscopy, where absorption or emission is measured as a function of energy (typically wavelength or frequency), two-dimensional spectroscopy allows analysis of the spectrum along two energy axes, exposing detail that is not present in one-dimension. These details consist of connections between electronic transitions, exciton – exciton coherences, population transfer, separate measurements of the homogeneous and inhomogeneous linewidth, or structural change to the molecules of interest. In a complex system, where there is an ensemble of different molecular configurations, this allows for tracking the evolution of subsets of the ensemble in time, whereas the one-dimensional spectrum is only the average of the ensemble. In other words, one can track the changes to absorption or emission of a sample at a given probe frequency caused by excitation in a narrow bandwidth.
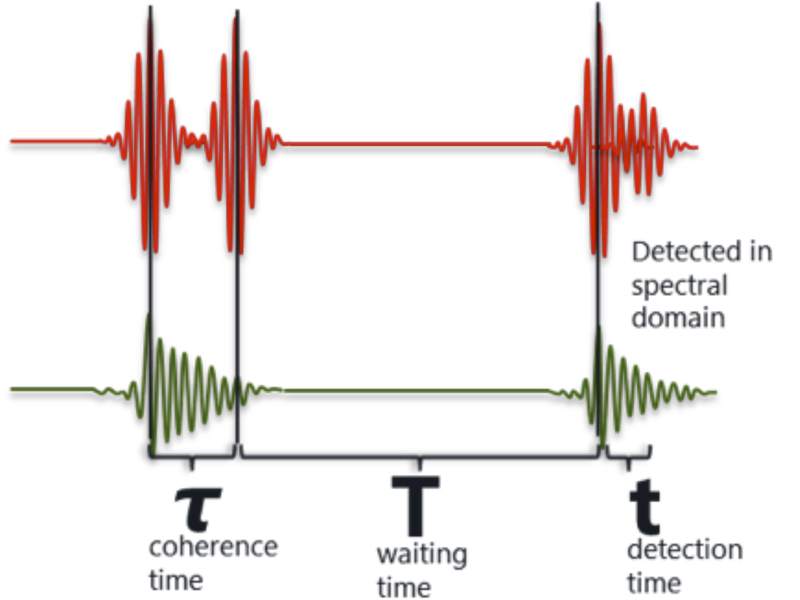
Two-dimensional spectroscopy with ultraviolet, visible, or infrared pulses in the time domain is only possible with the use of femtosecond pulses. The first pulse creates a coherent superposition between the ground and excited state of the sample, which oscillates and decays over the course of the coherence time, often denoted as τ. The second pulse converts and stores the superposition as a population in the ground and excited state. After a waiting time, denoted as T, another pulse, or series of pulses, recreates a superposition of states, which emits radiation that is typically measured in the spectral domain. The time between the third pulse and the measurement of the signal is referred to as the detection time and is denoted as t. Often, the data is converted to the frequency domain by Fourier transform with respect to τ and plotted versus the detection frequency.
It is important that there is a known and controllable phase relation between electric fields of the first two pulses. It is also important to have phase-resolved detection for the emitted signal, which also entails a high degree of phase stability. With visible pulses, this corresponds to less than a femtosecond stability between the pulses. It is then required to use a pulse shaper to form the first two pulses and in some cases to have active measurement or control of the relative phase of the pulses. The same can be said for the last two pulses, however, as previously discussed, when recorded in the frequency domain by interference , the phase stability is passively ensured.
2DSpec requires the use of Fastlite's Dazzler™ acousto-optic programmable dispersive filter to form the first two "pump" pulses with high precision in the control of relative phase and delay. The pump pulses take the optical path; they are collinear. The third pulse, or "probe," is crossed at a small angle with the pumps and the emitted signal is collinear and phase matched with the probe beam for subsequent heterodyne detection, with the probe serving as the local oscillator. Other 2D implementations use non-collinear phase matching of all pulses. While there are some advantages to this technique, the experimental implementation and resulting data analysis are much more difficult. In the "pump-probe" geometry the "absorptive," narrowed, line shape is directly extracted after Fourier transform. It is also possible to implement phase-cycling to extract other signals of interest.
Optimized Delay Stage for Spectroscopy
2DSpec benefits from the newly released DL series stages, which are ideal for ultrafast spectroscopy due to the fast velocity, acceleration, and repeatable positioning. The standard maximum optical delay between pump and probe in 2DSpec is 4.3 ns. This is limited by the length of the stage (325 mm) and the number of optical passes that the probe beam makes to and from the high quality retroreflector used on the stage. In standard configurations, there are four passes (to and from the retroreflector twice).
The resolution changes depending on the mode of operation. In the best case, the resolution is set by the minimal incremental motion (MIM) of the delay stage. This is applicable when performing a single measurement where the stage is incremented linearly in only one direction. In the standard 2DSpec configuration, this is ±1.0 fs. If many scans are to be averaged, the repeatability of positioning must be considered. If performing the same measurement, the uni-directional repeatability must be accounted for, which is 1 fs in the standard 2DSpec configuration. Lastly, if the set of time points is acquired randomly, as is often the case to minimize the effect of laser and sample changes to the measured dynamics, the bi-directional repeatability is the most important factor. For the standard 2DSpec, this has a value of ±2 fs. In a fast experiment, delay stage settling time is also a consideration, and the positioning may suffer if the settling time is low.
Since the time resolution is set by the convolution of the pump and probe duration --- with some small consideration for crossing angle --- the motion stage is more than sufficient for a pump-probe experiment when pulse widths are greater than 20 fs.
High Quality Components and Worldwide Support
Newport’s Two-dimensional spectrometer is assembled and thoroughly tested and calibrated by a dedicated team of scientists and engineers. 2DSpec is constructed from Newport’s highest quality components, for stable performance as well as increased durability and lifetime. Some examples are:
- Precision Grade (PG) series breadboard with patented integrated modal damping to lower vibrations.
- SUPREMA™ series optical mounts for reduced thermal fluctuations and increased stiffness.
- Forkless stainless steel optical pedestals for extra space and elimination of bending stress induced by clamping forks, while still maintaining flexibility in positioning.
The use of high quality components improves the resistance to vibration induced by the moving components, such as chopper, motion stage, and sample stirrer or recirculator, as well as reduced drift due to thermal changes.
More importantly, support and training is provided either locally or remotely, before, during and after installation. 2DSpec features free software upgrades for life, with support for customer inspired features as they are added.
Each system includes installation and training by a Newport scientist or engineer and includes high quality beam routing for steering the ultrafast amplified laser beams to the 2DSpec system.
Easy to Use Software
2DSpec comes with easy-to-use LabVIEW based software designed to speed up and simplify data collection with free updates for the lifetime of the product. The software seamlessly integrates the many devices used in 2DSpec, such as the Dazzler™, motion stage(s), camera(s), optical chopper, and spectrograph, with independent control options for each device. Most notably for 2DSpec, the Dazzler can be controlled to update the waveform on a pulse by pulse basis in preprogrammed schemes such as various phase cycling modes and full or partial rotating frame, so that the data acquisition is as fast and efficient as possible. In the preprogrammed schemes, the retrieved data is correctly assigned and processed for viewing. Additionally, user-defined phase cycling schemes can be easily programmed and analysis schemes can be written to LabVIEW.
The software features a Setup tab, where you can optimize the probe signal level, processed sample signal, delay line zero, chopper phase, and more on a real-time basis. After this is complete, data acquisition can be started on the Acquire and Plot tab. There are options for setting up the scan range and step size, as well as number of averages and selection of random or linear scan. The estimated time remaining for the scan is estimated initially and updates as the data is acquired. After a set of scans, the data display is updated. Scans for different waiting times (T) can be viewed sequentially. Every data point is saved to disk so that in case of a stopped scan, data is not lost. Saved data can also be reloaded for later viewing and a copy of the software can easily be run in data viewing mode on an office or home computer. The standard output file type is .csv with headers, however, fully customizable output file formats are also possible so loading the data into another software package is made very easy. Lastly, calibrations and advanced functions are mostly handled on the Diagnostics tab.
Flexible Detection
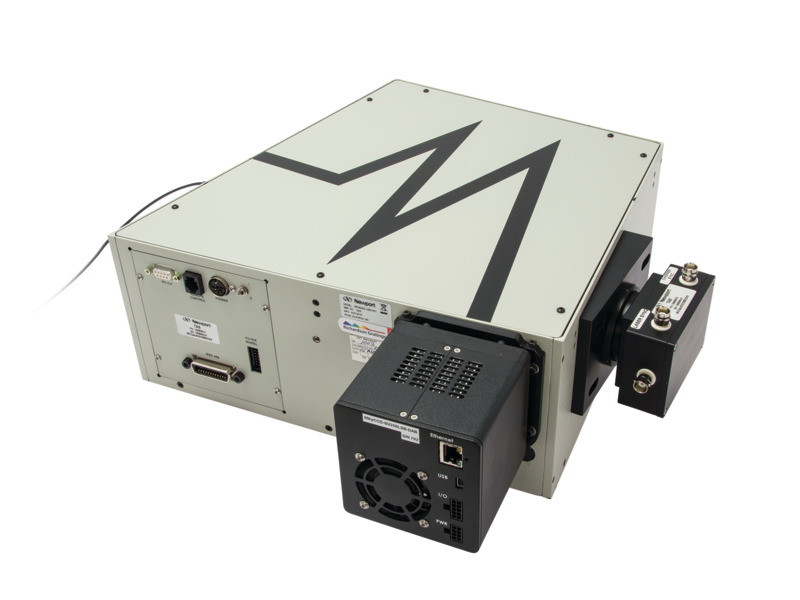
2DSpec employs the MS260i spectrograph for analyzing the 2DSpec signal. When integrated with the 2DSpec software, the MS260i supports automatic or computer controlled adjustment of spectral range, resolution, and camera or other light sensor. This is due to the MS260i’s support for up to two output ports and three gratings. Further, the MS260i is an essential laboratory tool that can be used for many experiments besides 2DSpec. With the full set of diffraction gratings offered, the instrument can function from 200 nm to 20 um, with spectral resolution ranging from 0.13 to 3.95 nm. Even more Richardson gratings can be ordered directly from www.gratinglab.com.
Free-space coupling to the spectrometer is required for 2DSpec in order to eliminate the spectral modulations to the spectrum that are present when fiber coupled. While a fiber may be adequate for one-dimensional pump-probe spectroscopy, because the kinetics and a single wavelength are unaffected by the spectral modulation, in two-dimensional spectroscopy, the results are typically displayed as a frequency-frequency correlation plot, and the spectral modulations may cause problems in data analysis. Also, in two-dimensional spectroscopy, data acquisition times are much longer than in one-dimensional pump-probe experiments, and benefit from the increased signal in the free-space coupling mode.
Flexible and Upgradable
The 2DSpec is designed with flexibility in mind. The basic system comes with the essential components required for ultrafast spectroscopy; however, almost every system that is shipped is specially built and tailored to meet the customers’ needs. Some things that are customized or upgraded are:
- Pump-probe delay step size (down to 0.13 fs)
- Addition of ultraviolet probe (CaF2 crystal) and motion system
- Reference channels for monitoring and correcting probe fluctuations
- Automated system alignment/realignment using patented GuideStar™ technology
- Sample – moving stage or thin flow cell with pump
- Additional gratings for higher spectral resolution / range
- Transient Absorption (TAS)
- Femtosecond Stimulated Raman Spectroscopy (FSRS)
Newport scientists and engineers are always working to support new additions and types of pump-probe spectroscopy, so, if you have an idea that you don’t see listed, feel free to inquire. Most features are offered as upgrades and can be added in the future as they are required, or as budget allows.
| 2DSpec Specification | Standard System | Maximum Upgrade |
| Probe Spectral Range | 470-1100 nm | 350-1600 nm |
| Pump-probe Delay Range | 4.3 ns | 4.3 ns |
| Delay Stage Step Size | 1 fs | 0.13 fs |
| Delay Stage Bi-Directional Repeatability | <4 fs | <4 fs |
| Delay Stage Maximum Speed | 6.67 ns/s | 6.67 ns/s |
| Delay Stage Maximum Acceleration | 100 ns/s2 | 571 ns/s2 |
| Supported Data Acquisition Rate | 10 Hz - 2 kHz @ 14-bit | 10 kHz @ 16-bit |
| Supported Laser Rate | 0 - 2 kHz | 0 - 200 kHz |
| Spectrometer Spectral Range | 300 - 900 nm | 200 - 20,000 nm |
| Spectrometer Spectral Resolution | 0.5 nm @ 800 nm | 0.13 to 7.95 nm |