This application kit addresses a means for monitoring the spectral profile of a laser pulse as a function of time. This technique is known as frequency-resolved optical gating (FROG) which is a general technique that can be employed in a variety of experimental geometries. The focus of this kit is on two geometries: self-diffraction (SD FROG) for amplified systems and second harmonic (SHG FROG) for oscillators.
As a consequence of the time-bandwidth uncertainty principle, ultrashort laser pulses carry significant bandwidth. If the spectral components that fall under the bandwidth of the laser pulse are time coincident (figure 1.1), the pulse is said to be at its transform limit. A transform-limited pulse implies that the pulse duration is minimized.
Figure 1.1: The temporal relationship between selected Fourier components of a transform-limited pulse.
Measuring Chirped Pulses
Material properties such as dispersion alter the (phase) relationship between the spectral components of light, effectively separating the blue and red components of the pulse in time (figure 1.2). This effect is known as chirp, and for an ultrashort pulse, serves to elongate the pulse in time. Although autocorrelation can measure the duration of an ultrashort pulse, it is unable to characterize the phase relationship between different spectral components. The primary reason for this is that autocorrelators utilizes a single element photodetector that effectively integrates over the spectral profile of the pulse.
Figure 1.2: The temporal relationship between selected Fourier components of a positively chirped pulse.
Frequency-Resolved Optical Gating (FROG)
Fortunately, techniques exist that monitor the spectral profile of a pulse as a function of time. These techniques allow for the complete reconstruction of the electric field. Of these techniques, frequency-resolved optical gating (FROG) is arguably the most straightforward and easiest to implement. As mentioned earlier, FROG allows for full phase retrieval of the input field without the ambiguity associated with autocorrelation. Our Amplitude and Phase Characterization of Ultrashort Laser Pulses application note presents a simple, low dispersion, easy-to-use, general purpose FROG device that can readily be implemented on the Newport Long Scan Autocorrelator platform as described in Application Note 27.
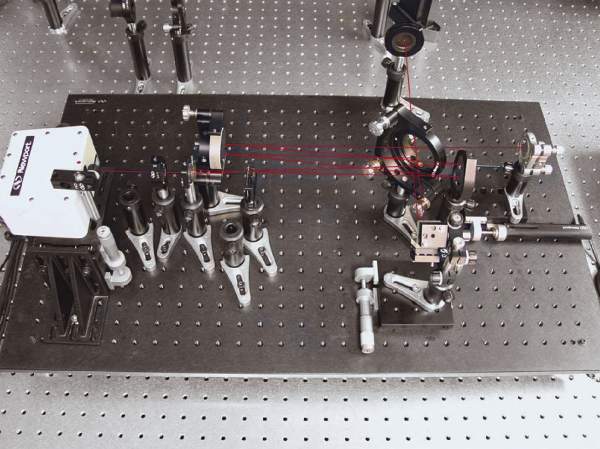
Self-diffraction FROG Geometry
Self-diffraction FROG (SD FROG) geometries are for amplified systems. The SD FROG trace gives an intuitive picture of the pulse (i.e. the direction of time is preserved), which is a highly desirable feature for real-time laser alignment. Moreover, the geometry is identical to the Long Scan Autocorrelator where the nonlinear medium is a thin piece of glass (<200 µm), thus making this geometry cost effective and straightforward to implement. On the downside, SD FROG requires relatively high peak powers not readily available from most ultrafast oscillators, so its use is restricted to amplified systems.
Diagram of SD FROG Setup
Second Harmonic FROG Geometry
Second harmonic FROG (SHG FROG) geometries are the only real option for ultrafast oscillators. An SHG FROG is simply a spectrally resolved autocorrelator. Although the sign of the spectral phase is lost in the measurement, efficient algorithms exist which can deduce the order and magnitude of the spectral phase where the sign can be determined if need by performing additional measurements. (Rick Trebino, "Frequency-Resolved Optical Gating: The Measurement of Ultrafast Laser Pulses", Norwell, MA, Kluwer Academic Publishers (2000)) If planning to use the standard kit with an oscillator, a BBO crystal used to generate the second harmonic – such as Newport model 90015087
Non Linear Crystal, 5x5x0.2mm BBO, Type 1, 48° 480-700nm, 1 in.
Sorry, this product is no longer offered for sale.It was discontinued on Oct 25, 2021.
(480-700 nm) – must also be purchased separately.
Diagram of SHG FROG Setup
Reference Software
The data acquisition and display software included with this product has been tested in the experimental setup described in the application note and is designed to work only with specific spectrometers. Third-party freeware software is available for interpretation and analysis of complex FROG traces. Please contact us to discuss a custom version of this kit or to get additional information related to acquiring FROG analysis software.
In order to provide better service and products, please provide the following brief information.
Password Reset
Enter your email address below to reset your account password.
Password Reset
Email Verification Required
Cart Items Updated
Remove Product
Remove this product from your comparison list?
Check Order Status
Provide an order number and postal code to check the status of an order or download an invoice for an order that has shipped. Login to view your complete order history.
Sign In Required
To access this and other valuable technical resources, please sign in or register for a new online account.
 Over 8,000 products in-stock! & FREE 2-Day shipping on all web orders!* Learn More FREE T-Shirt with orders $250+ Details


 Ultra-High Velocity