Insights Into Swept-Wavelength Characterization of Passive Fiber-Optic Components
Building a swept-wavelength system requires a tunable laser source, the device under test, power sensors, and a data-acquisition system. The swept-wavelength method for high-resolution wavelength characterization of passive fiber-optic components can characterize components more quickly than traditional methods—measurements that used to take minutes or even hours can now be made in seconds. The swept-wavelength method can even be used to make in-process, in-situ measurements, allowing you to trim and adjust devices in real time. In this application note, we will discuss:
- Defining wavelength-dependent measurements
- Building a swept-wavelength system
- Making a measurement
- Interpreting the data
For an overview of this technique and a comparison with traditional ones, see Application Note 10: Saving Time and Bringing Real-Time Process Control to the Manufacturing Environment.
Defining Wavelength-Dependent Measurements
With the growing complexity of WDM and DWDM network systems—more channels, narrower channel spacing, and wider wavelength ranges—it has become increasingly important to fully characterize the wavelength-dependent optical properties of both broadband network components (including couplers, combiners, splitters, attenuators, isolators, and circulators) and narrowband network components (including multiplexers, demultiplexers, interleavers, and wavelength filters).
Properties such as wavelength flatness and polarization-dependent loss can adversely affect overall network system performance. For narrow-band devices, it is especially important to measure the center wavelength, crosstalk, and, in some cases, channel spacing in order to optimize system performance. Since narrowband and broadband devices are used over the entire wavelength band, it is important to measure their optical properties not only at the channel of interest but also over the entire wavelength band. There are several techniques you can employ to measure different properties.
By measuring the throughput intensity as a function of wavelength, you can determine:
- Center wavelength
- Channel spacing
- Wavelength flatness
- Filter transfer function
- Crosstalk
By using differential techniques where part of the source is split off as a reference, you can measure insertion loss filter rejection. In combination with a polarization-state controller, you can assess:
- Polarization effects
- Polarization-dependent loss
So how many measurement points are required and how long does a typical measurement take? Consider a 50-GHz DWDM system (channel spacing of 0.4 nm) with 80 channels. With this system, one must characterize the device performance over a wavelength span of greater than 35 nm. With the requirement that the isolation between channels is over 30 dB—that is, the device loss 0.4-nm from line center is at least 30 dB—the measurement requires a resolution of 0.01 nm (10 pm) with a dynamic range of at least 30 dB. This means that a typical measurement must have at least 3,500 wavelength points.
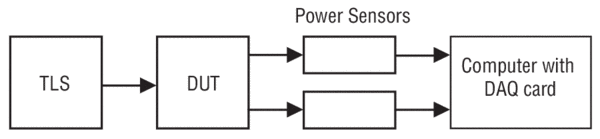
As an example, consider measuring the throughput of a 100-GHz interleaver. An interleaver separates odd and even channels into two separate outputs. It is used to multiplex or demultiplex DWDM channels. Thus, to ensure device performance, it is important to measure the throughput as a function of wavelength from both outputs. Using a traditional step-and-measure system, consisting of a tunable laser, the device under test, and power meters as shown in Figure 1, the data from both outputs was measured from 1525 nm to 1565 nm in 0.01-nm steps, resulting in 4,000 wavelength points and requiring over 2 hours to gather the data.
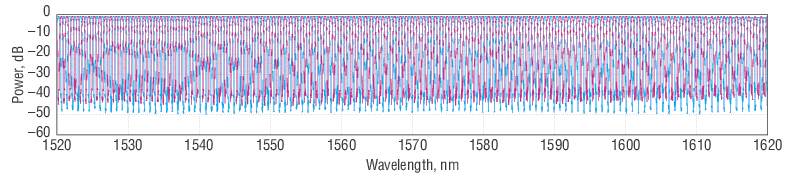
With the swept-wavelength system discussed in this application note, however, this same measurement can be performed in less than one second. Because of the significant economy in measurement times, the swept-wavelength method is ideally suited for time-consuming measurements of narrowband devices such as wavelength filters, interleavers, multiplexers, and demultiplexers, as well as polarization-sensitive devices such as polarization couplers. In comparison Figure 2 shows a measurement using the swept-wavelength technique. This measurement took 1-second at 3-pm resolution
Building a Swept-Wavelength System
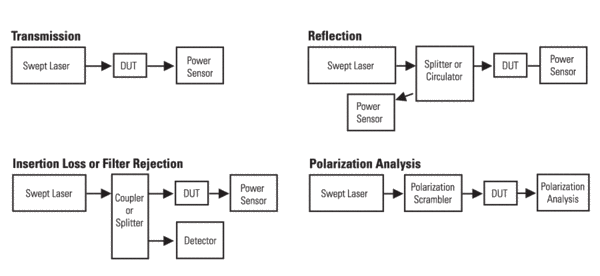
Building a swept-wavelength system is simple. It requires nearly the same equipment as the step-and-measure system: a tunable laser source, the device under test, power sensors, and a data acquisition system. It differs from the step-and-measure system only in the specific requirements of the source and the detectors. In the swept-wavelength system, the wavelength of the laser source is swept continuously at a constant rate while the output is recorded, providing a very high-resolution spectral picture at the speed of an OSA—fast enough to observe changes as a component is being adjusted. Typical system setups for measuring the transmission, reflection, and polarization effects of a device as a function of wavelength are shown in Figure 3. (For simplicity, the data acquisition system is not shown in the figures.)
The tunable laser source: The first and most important component in a swept-wavelength setup is the tunable laser source. The source must have a very linear, repeatable, and mode-hop-free scan. The New Focus™ TLB-6600 tunable laser is such a source. It was designed specifically for swept-wavelength measurements, and incorporates a motor design to ensure very high linearity and repeatability of the scan over its entire mode-hop-free wavelength range over both C- and L-bands. Peak wavelength deviation from linearity is typically less than ±20 pm.
Another important feature of the tunable source is a trigger signal. In a sweep, an electrical trigger signal alerts the data-acquisition system (whether a computer or an oscilloscope) to begin taking data. The trigger accuracy and jitter, in conjunction with the laser's deviation from linearity, determines the system's wavelength accuracy.
Wavelength repeatability from scan to scan is also important if you're watching in real time. Any inaccuracy will cause the data to shift with respect to wavelength from scan to scan, and determining real-time changes from spurious shifts will be difficult. The wavelength repeatability from scan to scan of the TLB-6600 is typically ±2.5 pm and less than ±15 pm maximum
Finally, the last consideration for the tunable source is the stability of the output power. There are two aspects: power flatness within the scan and power repeatability from scan to scan. Power flatness within a scan is how constant the output power is during a single wavelength scan and is important if you're looking at a single scan. Power repeatability from scan to scan is a measure of how stable the output power as the laser makes many wavelength scans. This is especially important when looking in real time because any changes in power from scan to scan can look like changes to the device rather than fluctuations from the laser.
The power sensor: The next component that is required in the swept-wavelength system, not including the device under test, is the power meter or power meters if monitoring multiple channels. The high-dynamic-range (HDR) power sensors from New Focus™ are ideal for swept-wavelength measurements. While most conventional power meters are too slow for the 100-nm/s sweep speeds of today's swept-wavelength lasers or lack the necessary sensitivity for low-noise systems, the Models 210X were designed specifically to be used with swept-wavelength lasers like our TLB-6600, they respond rapidly and with sensitivity over a wide wavelength range and a wide optical power range.
The data-acquisition system: If you'd like to record and store the data, the best method is to use a data-acquisition system consisting of a data-acquisition board followed by a PC. One DAQ board that we recommend is the National Instruments™ AT-MIO-16XE-10 that has up to 100-kS/s, 16-bit resolution, with a choice of either 16 or 64 single-ended analog inputs
Making a Measurement
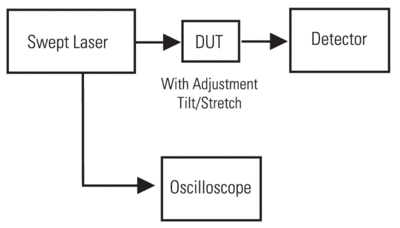
Using an oscilloscope: For relative measurements, view the real-time, high-resolution data using the equipment shown in Figure 5. In this example, the laser is programmed to sweep over the wavelength range of interest. The optical output is sent to the device under test (DUT) and then to a detector. The output from the detector is displayed on an oscilloscope, triggered using the laser's wavelength-trigger output. The stability of the wavelength trigger and the repeatability of the laser scan ensure that motion seen on the oscilloscope is due to the spectral change of the DUT.
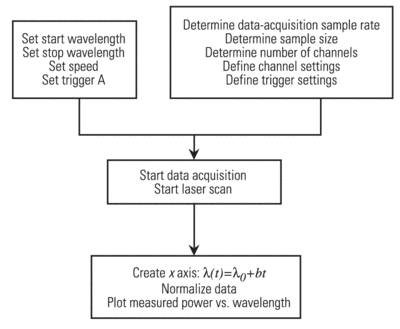
Using a computer: If you want to store and/or normalize the data, you'll need to use a computer to gather the data as the laser sweeps over the wavelength range of interest. In this case the electrical trigger is used to tell the computer to begin taking data.
Interpreting the Data
Translating from time to wavelength: In the swept-wavelength method, the laser sweeps the wavelength with respect to time,so the x-axis on the oscilloscope represents wavelength. You can use the following equation:
Wavelength = Wavelengthstart + Scan speed • Elapsed time from beginning of scan
Determining the wavelength accuracy:
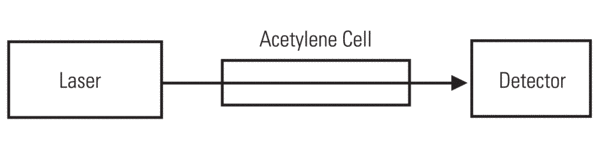
For applications requiring increased wavelength accuracy, use an optical reference as a trigger source rather than the supplied electrical trigger. For example, by using the optical absorption lines from an acetylene gas, as shown in Figure 7, the absolute trigger accuracy can be improved from ±20 pm to less than 10 pm. In this setup, a portion of the output laser intensity is diverted, passed through an acetylene absorption cell, and detected. Wavelength reference cells can be obtained from a variety of sources such as NIST (specifically #SRM2517), Opthos (ph:301-926-0589) and Wavelength References (ph:503-632-5240). The output is sent to one of the inputs of the data acquisition system.
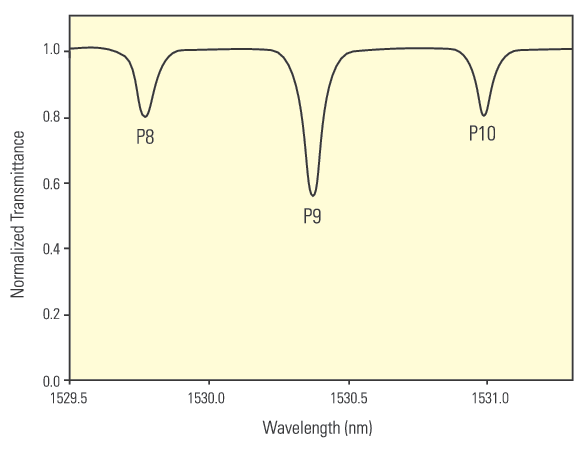
By using a typical minimum-detection algorithm, one of the absorption minima can be used as the reference trigger rather than the electrical trigger, improving the overall trigger jitter to less than 10 pm. With this setup, the overall wavelength accuracy would be within ±20 pm and is limited mainly by the sweep linearity and the RWA curve.
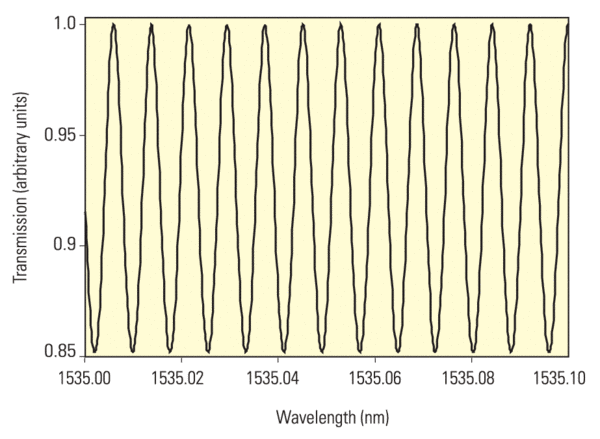
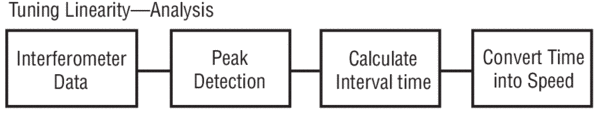
The key to making further improvements is detecting the sweep linearity. Sweep linearity consists of two factors: the best-fit average speed, and any momentary deviations from the average speed. Both can be measured by measuring the transmission through an étalon while making the wavelength measurements on the DUT. An effective and simple étalon is a non-angled short length of fiber (0.1 to 1 meter in length with FC/PC connectors) between two other APC fibers— one coming from the laser source and the other going to the detection system. As the laser wavelength is swept, the transmission through the étalon as a function of wavelength can be expressed as:
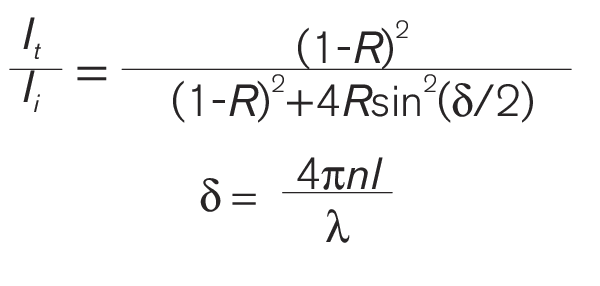
Where:
R is the reflectivity of the end surfaces,
n is the index of refraction,
l is the length of the fiber, and
λ is the wavelength.
Figure 9 shows how the transmission varies as a function of wavelength for a fiber of length 0.1 m. The transmission is at a maximum whenever 2nl/l is an integer. Thus by detecting the peak and measuring the time interval between peaks, you can determine the average speed from peak to peak. In addition, the actual peaks are frequency markers that determine the momentary relative wavelength change. Thus with this inexpensive étalon, you can measure both the average speed as well as the relative wavelength change, and therefore the deviations from linearity