Solar UV and Ozone Layer

Atmospheric Gases Block UV <290 nm

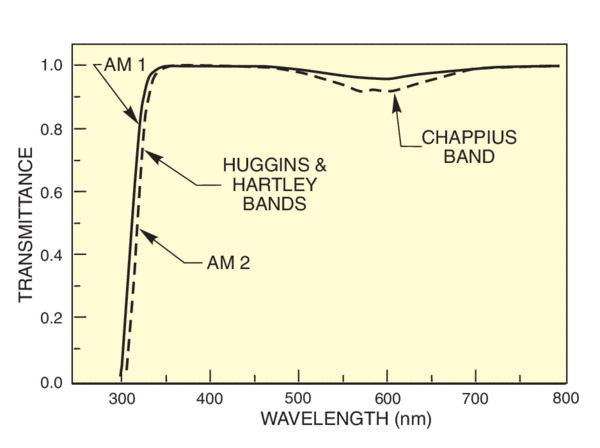
The column of absorbing gas in the path of incoming radiation includes atomic and molecular nitrogen and oxygen and their products. These gases block all short wave ultraviolet radiation. Molecular oxygen in the stratosphere (10 to 48 km) absorbs short wave (up to 242.4 nm from the ground state and with very strong bands from 50-100 nm, and 140-175 nm) ultraviolet and photodissociates. The atomic oxygen produced leads to the production of ozone. Ozone strongly absorbs longer wave ultraviolet in the Hartley and Huggins bands from 200 - 360 nm (Fig. 1), and has additional weak absorption bands in the visible (Chappius bands from 450 - 750 nm) and infrared.

Graph of transmittance of the ozone layer
Figure 1. Transmittance of ozone layer.

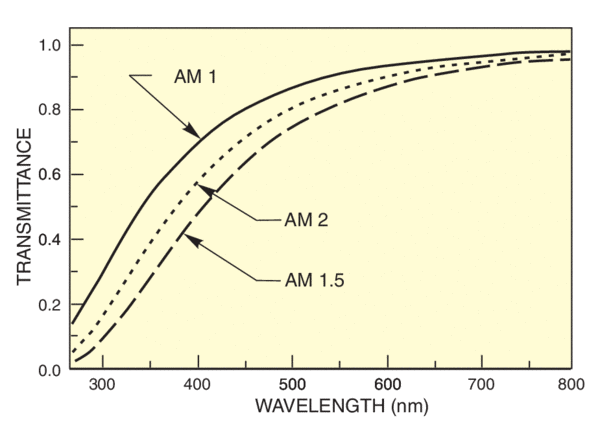
Absorption in the Herzberg continuum of the abundant molecular oxygen blocks most ultraviolet up to ca. 250 nm. Rayleigh scattering by air molecules (Fig. 2) and the strong ozone absorption from 200 - 290 nm determine the terrestrial ultraviolet edge at around 290 nm. Ozone absorption is variable however, since the amount of ozone in the upper atmosphere depends in a complex manner on formation and circulation patterns of the ozone and on the long-lived catalytic chemicals that destroy ozone.

Graph of Rayleigh scattering and impact on transmittance
Figure 2. Rayleigh scattering; impact on transmittance.

Variable Ozone Level Means Variable Absorption Edge

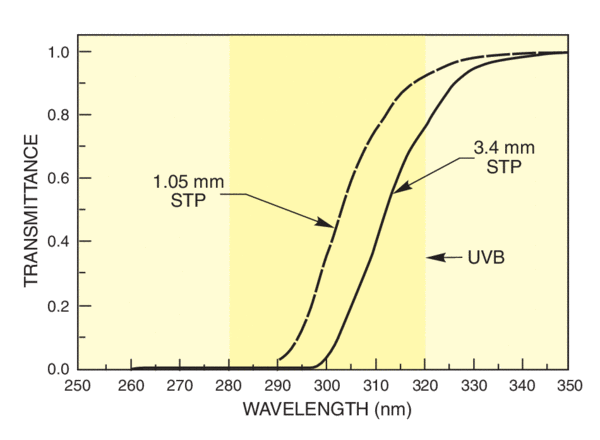
The ozone level is quantified as the corresponding path length of the gas at standard temperature and pressure (STP) or in Dobson units (D.U.), the number of milliatmosphere centimeters of ozone at STP. Typical ozone levels vary from 2.4 mm (STP) or 240 D.U. at the equator increasing with latitude to 4.5 mm at the North Pole. Seasonal variation is highest at the poles. Prior to the report of the ozone hole, the ozone level at the North Pole was known to drop to ~2.6 mm (STP) in October. Antarctic levels as low as 1.1 mm (STP) have been reported and attributed to chemical destruction of ozone. The ASTM standard spectra use 3.4 mm ozone in the computation, as this is the expected average value for the U.S.

Since ozone is the principal absorber of solar radiation in the 250 - 300 nm region, with the strong slope shown in Figure 3, ozone depletion leads to increased levels of UVB. We discuss some of the implications of this in our section on Photochemistry and Photobiology. Ironically, ground level ozone, a pollutant in heavily industrialized or populated areas, seems to reduce UV irradiation there.

Graph of UV transmittance of normal and depleted ozone layer
Figure 3. UV transmittance of normal and depleted ozone layer.

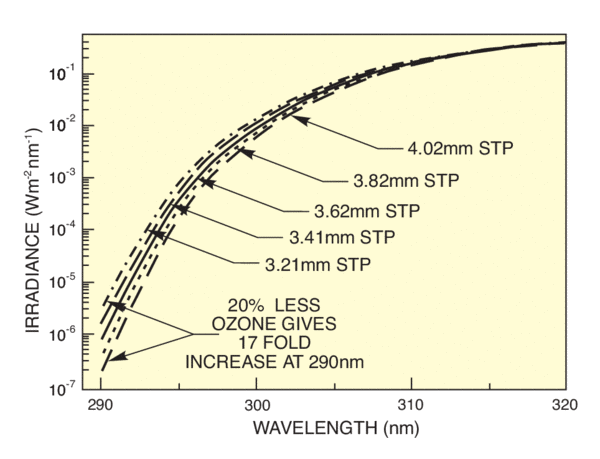
Figure 4 shows how the calculated terrestrial ultraviolet at 50° latitude changes with ozone depletion. This figure is based on data taken from Vol. I of the UVB Handbook by Gerstl et al. of Los Alamos National Laboratory.

Graph of UV irradiance and ozone depletion
Figure 4. UV irradiance and ozone depletion.