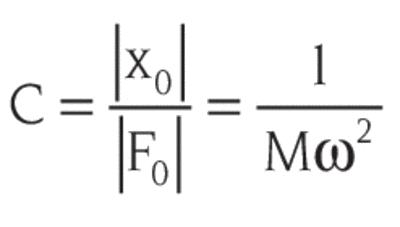
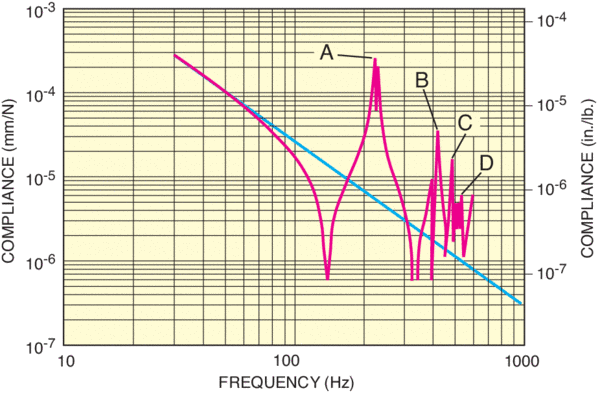
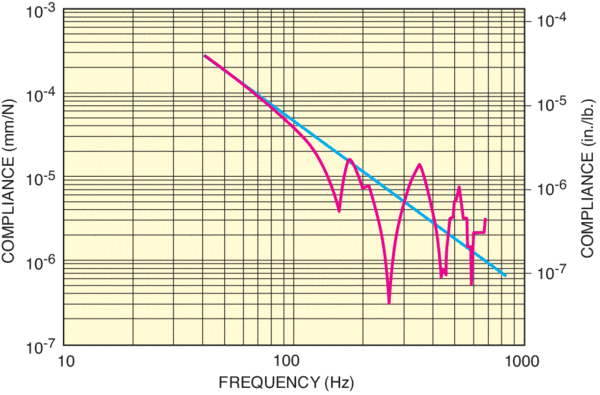
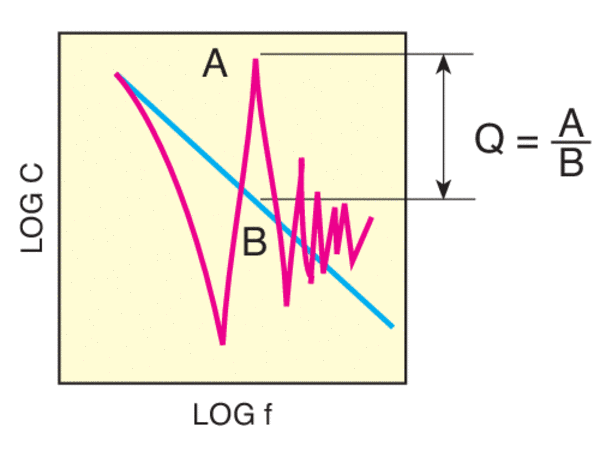
A table top’s response to vibration depends on the frequency range. Consider the compliance curve shown in Figure 5 for an aluminum honeycomb table top. For low frequencies the compliance decreases inversely proportional to the square of the applied frequency (ω= 2πf). In other words, the structure is behaving as an “ideal rigid body.” The Ideal Rigid Body line is included on all Newport compliance curves in order to measure the structural damping of a table top via the dynamic deflection coefficient, and is shown as the straight line (B) in Figure 5.
For frequencies greater than 80 Hz, the compliance curve begins to deviate from this line, and the table can no longer be thought of as an ideal rigid body. Above 80 Hz, structural vibrational modes are excited, and the table begins to deform. Peaks of maximum compliance (C, D, E, F and G) correspond to the table’s resonance modes (approximately 220, 290, 420, 495 and 600 Hz).
The rigid body compliance falls off rapidly as frequency increases, so the largest displacements are generally caused by low-frequency resonances. The first peak on the left has usually the highest amplitude and dominates the table’s response to vibration. In Figure 4, for example, 220 Hz is the minimum resonant frequency or natural frequency (fn) of the table top. The highest possible minimum resonant frequency is desirable, because the amplitude of table displacements is much smaller at higher frequencies, providing greater stability.
 Over 8,000 products in-stock! & FREE 2-Day shipping on all web orders!* Learn More FREE T-Shirt with orders $250+ Details
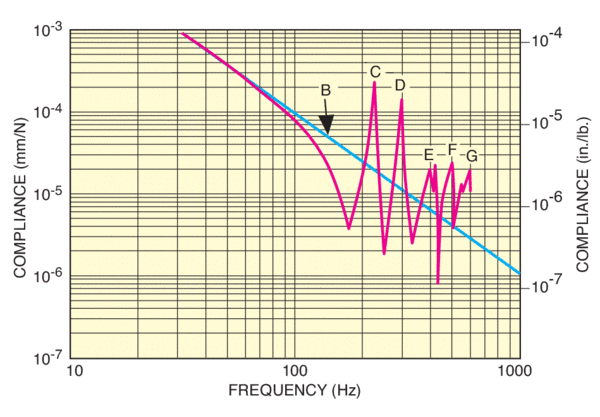
 Ultra-High Velocity