Understanding the Compliance Curve

No actual structure is a perfectly rigid body - all structures vibrate by flexing and twisting. The response of structures to random vibrations can be quite complicated because they vibrate with complex deformations and have more than one resonant frequency. The compliance curve, the classic method of measuring dynamic rigidity, is a useful tool for evaluating the basic dynamics of a vibrating structure. The curve supplies information on the two key parameters that govern dynamic performance - minimum resonant frequency and maximum amplification at resonance, which can be used to calculate the actual relative motion between two points on the structure’s surface.

Vibration compliance curve
Figure 1. The compliance curve is a useful tool for evaluating the basic dynamics of a vibrating structure.

Starting to Quantify Dynamic Rigidity: Compliance

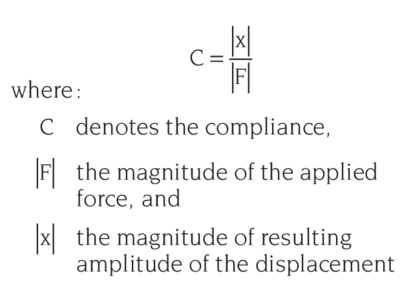
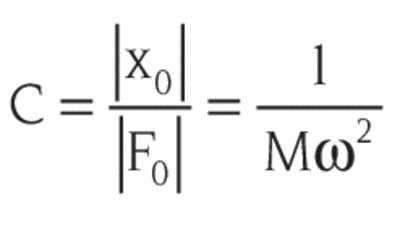
“Compliance” is a measure of the susceptibility of a structure to move as a result of an external force. The greater the compliance (i.e., the lower the stiffness), the more easily the structure moves as a result of an applied force. Compliance curves show the displacement amplitude of a point on a body per unit force applied, as a function of frequency. Expressed as a formula:

The units of compliance are displacement force; for example, mm/Newton or inches/pound.

Compliance of a Free Ideal Rigid Body

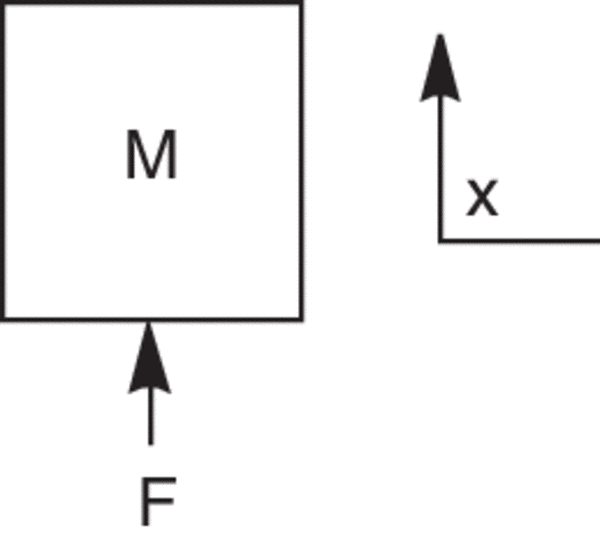
The free ideal rigid body model, Mx¨=F.
Figure 2. The free ideal rigid body model, Mx¨=F.

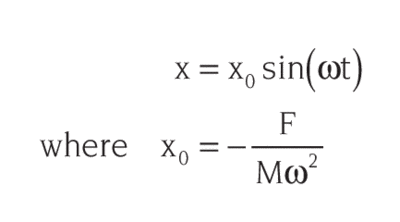
The theoretical model for compliance is the free ideal rigid body. We wish to know what happens when an external force F is applied to a rigid body of mass M, as shown in Figure 2. When a simple harmonic force is applied, the steady-state solution is:

This means that the body moves back and forth in a sinusoidal fashion, and the amplitude of the motion is inversely proportional to the square of the input angular frequency, ω. In this example, the compliance C is simply the magnitude of |x0| divided by the magnitude of the force, |F|, or:

The compliance of a rigid body, therefore, is proportional to 1/ω2 and is graphed as a straight line with slope of -2 on a log–log plot. This line, which is called the Ideal Rigid Body line, represents the dynamic performance of a theoretically perfect rigid table.

The Table Top Compliance Curve

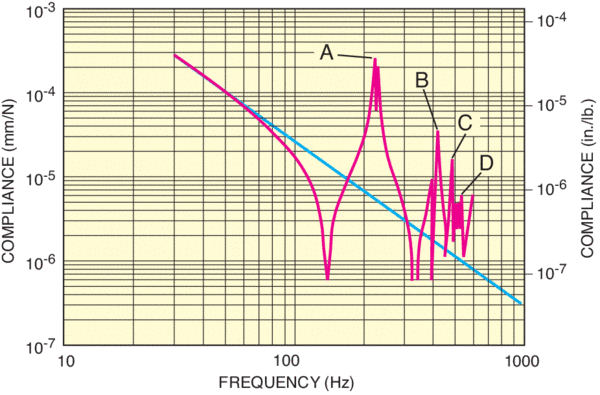
The dynamic performance of a table top is usually characterized with a compliance curve, a log–log plot of the table’s dynamic response to random vibration. For non-rigid bodies, a compliance curve shows the structure’s resonant frequencies and its maximum amplification at resonance. With other information, compliance curves can also furnish a reliable estimate of how a particular system will perform in your application.

Typical compliance curve of an undamped table top
Figure 3. Typical compliance curve of an undamped table top.

Resonances and Minimum Frequency (fn)

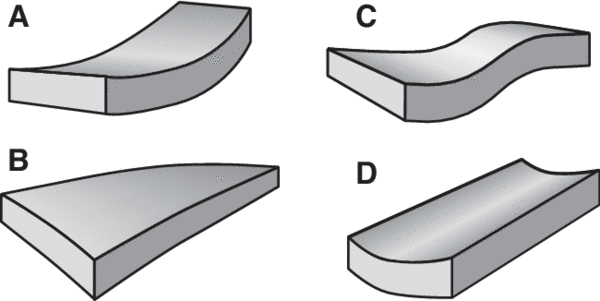
Figures 3 and 4 show the relationship between an undamped table top’s vibration modes and the peaks on its compliance curve. Each peak in the curve, marked A through D, corresponds to a fundamental vibration mode. Figure 4 shows the associated vibrational modes occurring at the frequencies seen in Figure 3.

Vibrational modes of table top associated with compliance curve
Figure 4. Vibrational modes of table top associated with compliance curve in Figure 3.

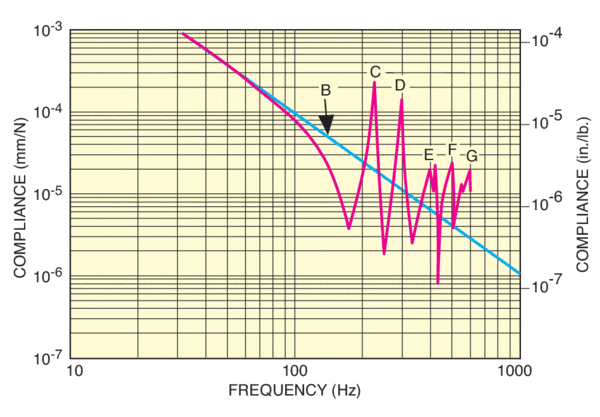
A table top’s response to vibration depends on the frequency range. Consider the compliance curve shown in Figure 5 for an aluminum honeycomb table top. For low frequencies the compliance decreases inversely proportional to the square of the applied frequency (ω= 2πf). In other words, the structure is behaving as an “ideal rigid body.” The Ideal Rigid Body line is included on all Newport compliance curves in order to measure the structural damping of a table top via the dynamic deflection coefficient, and is shown as the straight line (B) in Figure 5.

For frequencies greater than 80 Hz, the compliance curve begins to deviate from this line, and the table can no longer be thought of as an ideal rigid body. Above 80 Hz, structural vibrational modes are excited, and the table begins to deform. Peaks of maximum compliance (C, D, E, F and G) correspond to the table’s resonance modes (approximately 220, 290, 420, 495 and 600 Hz).

The rigid body compliance falls off rapidly as frequency increases, so the largest displacements are generally caused by low-frequency resonances. The first peak on the left has usually the highest amplitude and dominates the table’s response to vibration. In Figure 4, for example, 220 Hz is the minimum resonant frequency or natural frequency (fn) of the table top. The highest possible minimum resonant frequency is desirable, because the amplitude of table displacements is much smaller at higher frequencies, providing greater stability.

Compliance curve for an aluminum honeycomb core table top
Figure 5. Compliance curve for an aluminum honeycomb core table top.

Maximum Amplification at Resonance (Q)

Damping of table top resonance modes is critical for maximum stability. Effective table top damping reduces compliance (i.e., reduces the height of resonance peaks). The goal is to design a table top whose compliance curve deviates as little as possible from its theoretical ideal rigid body line. Absolute compliance values that are not referenced or compared to the Ideal Rigid Body provide little indication of the table top’s structural damping.

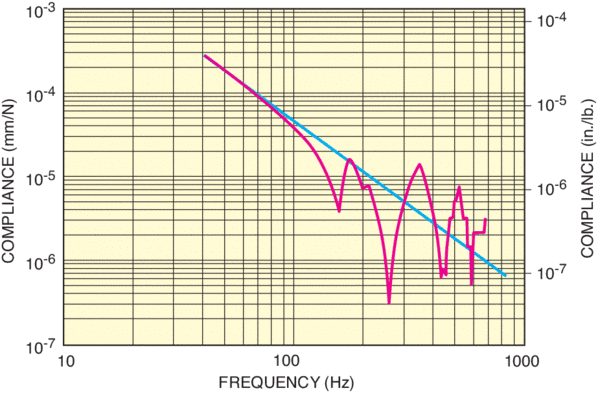
A quick glance at a compliance curve can provide a rough estimate of the quality of damping. For example, in Figures 5 and 6, it is intuitively obvious that the damping in the table shown in Figure 6 is superior. But by how much? When comparing curves by eye, logarithmic plots can be quite deceptive. Fortunately, it is very easy to obtain a precise comparison of relative damping efficiency by determining a table top’s maximum amplification at resonance.

Compliance curve for a steel honeycomb core table top
Figure 6. Compliance curve for a steel honeycomb core table top.

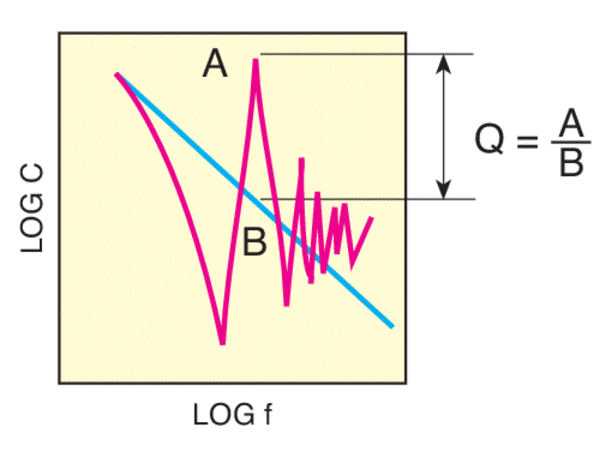
Maximum amplification at resonance, or Q, is a measure of how much the compliance curve deviates from the ideal rigid body line. In exact terms, it is defined as the maximum compliance value of the highest peak above the ideal rigid body line (usually, but not always, the first peak on the left) divided by the ideal rigid body response at the same frequency, see Figure 7. The lower the Q a structure has, the better it is damped and the more stable the structure will be. A structure’s Q and corresponding resonant frequency together determine its Dynamic Deflection Coefficient.

Maximum amplification at resonance (Q)
Figure 7. Maximum amplification at resonance (Q).

Q can be easily calculated from any compliance curve. If a curve does not have a rigid body line, make sure to draw one. The line should be tangent to the “straight” part of the compliance curve, and should have a slope of -2 (a 10-fold increase in frequency corresponds to a 100-fold decrease in compliance). Be wary of compliance curves that have ideal rigid body lines that don’t have slopes of -2.

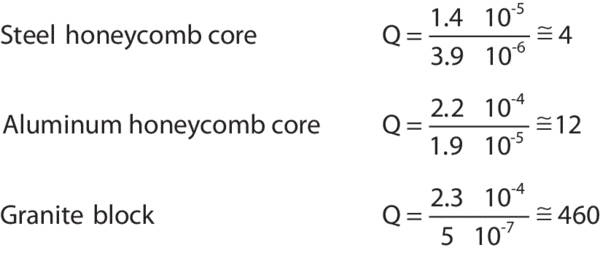
Example:

Calculation of the maximum amplification at resonance (Q) for the honeycomb core table tops is shown in Figures 4 and 5, revealing that the steel-core table in Figure 5 damps out about 3 times more effectively than the aluminum-core table in Figure 4. The Q of a typical granite block (compliance curve not shown) is also included for your comparison.