Introduction to Solar Radiation
Radiation from the sun sustains life on earth and determines climate. The energy flow within the sun results in a surface temperature of around 5800 K, so the spectrum of the radiation from the sun is similar to that of a 5800 K blackbody with fine structure due to absorption in the cool peripheral solar gas (Fraunhofer lines).
Solar Constant and "Sun Value"
The irradiance of the sun on the outer atmosphere when the sun and earth are spaced at 1 AU - the mean earth/sun distance of 149,597,890 km - is called the solar constant. Currently accepted values are about 1360 W m-2 (the NASA value given in ASTM E 490-73a is 1353 ±21 W m-2). The World Metrological Organization (WMO) promotes a value of 1367 W m-2. The solar constant is the total integrated irradiance over the entire spectrum (the area under the curve in Figure 1 plus the 3.7% at shorter and longer wavelengths.
The irradiance falling on the earth's atmosphere changes over a year by about 6.6% due to the variation in the earth/sun distance. Solar activity variations cause irradiance changes of up to 1%. For Solar Simulators, it is convenient to describe the irradiance of the simulator in “suns.” One “sun” is equivalent to irradiance of one solar constant.
Extraterrestrial Spectra
Figure 1 shows the spectrum of the solar radiation outside the earth's atmosphere. The range shown, 200 - 2500 nm, includes 96.3% of the total irradiance with most of the remaining 3.7% at longer wavelengths. Many applications involve only a selected region of the entire spectrum. In such a case, a "3 sun unit" has three times the actual solar irradiance in the spectral range of interest and a reasonable spectral match in this range.
Example
The model 91160 Solar Simulator has a similar spectrum to the extraterrestrial spectrum and has an output of 2680 W m-2. This is equivalent to 1.96 times 1367 W m-2 so the simulator is a 1.96 sun unit.
Terrestrial Spectra
The spectrum of the solar radiation at the earth's surface has several components (see Figure 2). Direct radiation comes straight from the sun, diffuse radiation is scattered from the sky and from the surroundings. Additional radiation reflected from the surroundings (ground or sea) depends on the local "albedo." The total ground radiation is called the global radiation. The direction of the target surface must be defined for global irradiance. For direct radiation the target surface faces the incoming beam.
All the radiation that reaches the ground passes through the atmosphere, which modifies the spectrum by absorption and scattering. Atomic and molecular oxygen and nitrogen absorb very short wave radiation, effectively blocking radiation with wavelengths <190 nm. When molecular oxygen in the atmosphere absorbs short wave ultraviolet radiation, it photodissociates. This leads to the production of ozone. Ozone strongly absorbs longer wavelength ultraviolet in the Hartley band from 200 - 300 nm and weakly absorbs visible radiation. The widely distributed stratospheric ozone produced by the sun's radiation corresponds to approximately a 3 mm layer of ozone at STP. The "thin ozone layer" absorbs UV up to 280 nm and (with atmospheric scattering) shapes the UV edge of the terrestrial solar spectrum.
Water vapor, carbon dioxide, and to a lesser extent, oxygen, selectively absorb in the near infrared, (as indicated in Figure 3). Wavelength dependent Rayleigh scattering and scattering from aerosols and other particulates, including water droplets, also change the spectrum of the radiation that reaches the ground (and make the sky blue). For a typical cloudless atmosphere in summer and for zero zenith angle, the 1367 W m-2 reaching the outer atmosphere is reduced to ca. 1050 W m-2 direct beam radiation, and ca. 1120 W m-2 global radiation on a horizontal surface at ground level.
The Changing Terrestrial Solar Spectrum
Absorption and scattering levels change as the constituents of the atmosphere change. Clouds are the most familiar example of change; clouds can block most of the direct radiation. Seasonal variations and trends in ozone layer thickness have an important effect on terrestrial ultraviolet level.
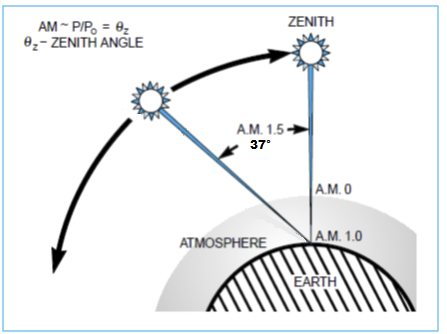
The ground level spectrum also depends on how far the sun's radiation must pass through the atmosphere. Elevation is one factor. Denver has a mile (1.6 km) less atmosphere above it than does Washington, and the impact of the time of year on solar angle is important, but the most significant changes are due to the earth's rotation (see Figure 4). At any location, the length of the path the radiation must take to reach ground level changes as the day progresses. So not only are there the obvious intensity changes in ground solar radiation level during the day, going to zero at night, but the spectrum of the radiation changes through each day because of the changing absorption and scattering path length.
With the sun overhead, direct radiation that reaches the ground passes straight through the entire atmosphere, all of the air mass, overhead. We call this radiation "Air Mass 1 Direct" (AM 1D) radiation, and for standardization purposes we use a sea level reference site. The global radiation with the sun overhead is similarly called "Air Mass 1 Global" (AM 1G) radiation. Because it passes through no air mass, the extraterrestrial spectrum is called the "Air Mass 0" spectrum.
The atmospheric path for any zenith angle is simply described relative to the overhead air mass (Figure 4). The actual path length can correspond to air masses of less than 1 (high altitude sites) to very high air mass values just before sunset. Our Oriel Solar Simulators use filters to duplicate spectra corresponding to air masses of 0, 1, 1.5 and 2, the values on which most comparative test work is based.
Standard Spectra
Solar radiation reaching the earth's surface varies significantly with location, atmospheric conditions including cloud cover, aerosol content, and ozone layer condition, and time of day, earth/sun distance, solar rotation and activity. Since the solar spectra depend on so many variables, standard spectra have been developed to provide a basis for theoretical evaluation of the effects of solar radiation and as a basis for simulator design. These standard spectra start from a simplified (i.e. lower resolution) version of the measured extraterrestrial spectra, and use sophisticated models for the effects of the atmosphere to calculate terrestrial spectra.
The most widely used standard spectra are those published by The Committee Internationale d'Eclaraige (CIE), the world authority on radiometeric and photometric nomenclature and standards. The American Society for Testing and Materials (ASTM) publish three spectra - the AM 0, AM 1.5 Direct and AM 1.5 Global for a 37° tilted surface. The conditions for the AM 1.5 spectra were chosen by ASTM "because they are representative of average conditions in the 48 contiguous states of the United States". Figure 5 shows typical differences in standard direct and global spectra. These curves are from the data in ASTM Standards, E 891 and E 892 for AM 1.5, a turbidity of 0.27 and a tilt of 37° facing the sun and a ground albedo of 0.2.
Table 1 Power Densities of Published Standards
| Solar Condition | Standard | Power Density (Wm-2) | ||
|---|---|---|---|---|
| Total | 250 - 2500 nm | 250 - 1100 nm | ||
| WMO Spectrum | 1367 | |||
| AM 0 | ASTM E 490 | 1353 | 1302.6 | 1006.9 |
| AM 1 | CIE Publication 85, Table 2 | 969.7 | 779.4 | |
| AM 1.5 D | ASTM E 891 | 768.3 | 756.5 | 584.7 |
| AM 1.5 G | ASTM E 892 | 963.8 | 951.5 | 768.6 |
| AM 1.5 G | CEI/IEC* 904-3 | 1000 | 987.2 | 797.5 |
* Integration by modified trapezoidal technique
CEI - Commission Electrotechnique Internationale
IEC - International Electrotechnical Commission
The appearance of a spectrum depends on the resolution of the measurement and the presentation. Figure 6 shows how spectral structure on a continuous background appears at two different resolutions. It also shows the higher resolution spectrum smoothed using Savitsky-Golay smoothing. The solar spectrum contains fine absorption detail that does not appear in our spectra. Figure 7 shows the detail in the ultraviolet portion of the World Metrological Organization's (WMO) extraterrestrial spectrum. Figure 7 also shows a portion of the CEI AM 1 spectrum. The modeled spectrum shows none of the detail of the WMO spectrum, which is based on selected data from many careful measurements.
The spectra we present for our product, and most available reference data, is based on measurement with instruments with spectral resolutions of 1 nm or greater. The fine structure of the solar spectrum is unimportant for all the applications we know of; most biological and material systems have broad radiation absorption spectra. Spectral presentation is more important for simulators that emit spectra with strong line structure. Low resolution or logarithmic plots of these spectra mask the line structure, making the spectra appear closer to the sun's spectrum. Broadband measurement of the ultraviolet output results in a single total ultraviolet irradiance figure. This can imply a close match to the sun. The effect of irradiance with these simulators depends on the application, but the result is often significantly different from that produced by solar irradiation, even if the total level within specified wavelengths (e.g. UVA, 320 - 400 nm) is similar.
Geometry of Solar Radiation
The sun is a spherical source of about 1.39 million km diameter, at an average distance (1 astronomical unit) of 149.6 million km from earth. The direct portion of the solar radiation is collimated with an angle of approximately 0.53° (full angle), while the "diffuse" portion is incident from the hemispheric sky and from ground reflections and scatter. The "global" irradiation, the sum of the direct and diffuse components, is essentially uniform. Since there is a strong forward distribution in aerosol scattering, high aerosol loading of the atmosphere leads to considerable scattered radiation appearing to come from a small annulus around the solar disk, the solar aureole. This radiation mixed with the direct beam is called circumsolar radiation.
Dirunal and Annual Variation
Figures 9 and 10 show typical diurnal variations of global solar radiative flux. Actual halfwidth and peak position of the curve shape depend on latitude and time of year. Figure 9 shows a cloudless atmosphere.
Figure 10 shows the impact of clouds.
Figure 11 shows the global solar irradiance at solar noon measured in Arizona, showing the annual variation.
Advantages of Simulators; Predictable, Steady Output
Outdoor exposure is the ultimate test of the weather resistance for any material or product. Solar Simulators offer significant advantages because of the unpredictable variation and limited availability of solar radiation. With a simulator, you can carry out tests when you want to, and continue them 24 hours a day, and you can control the humidity and other aspects of the local environment. You can repeat the same test in your laboratory or at any other site, and you can relate the exposure to the internationally accepted solar irradiation levels. As with direct solar irradiance, you can concentrate the beam for accelerated testing.