How to Approximate an Optical Tables "Ideal Rigid Body" Line

About Compliance

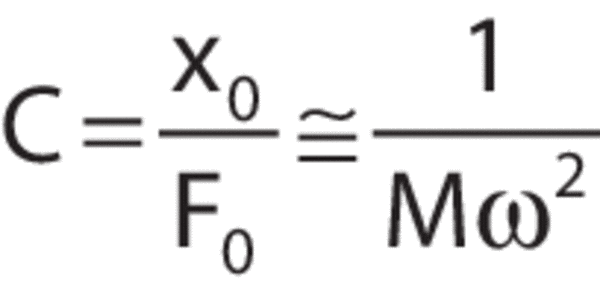
The compliance of a body is defined as the displacement amplitude of a point on the table surface per unit of force applied. Under the influence of a time-varying force, the compliance of a free ideal rigid body in one dimension is proportional to the inverse square of the frequency:

Where:
C = compliance
x0 = displacement
F = applied force
M = mass
ω = forcing frequency (rad/s) 2πf when f is frequency in Hz

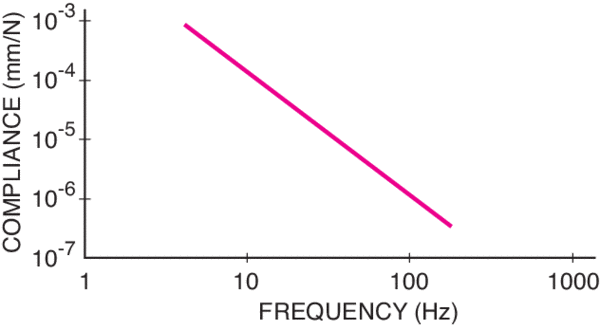
When plotted on a log–log plot, the compliance of a perfectly rigid body is always a straight line with a slope of -2. This line, called the Ideal Rigid Body (IRB) line, is a fundamental feature of a table top’s compliance curve and is the starting point for a meaningful evaluation of a table top’s dynamic performance.

Compliance of an Ideal Rigid Body
Figure 1. Compliance of an Ideal Rigid Body.

So far, so good. But a few customers have noticed that when they use this formula to approximate an Ideal Rigid Body line for a table top, the result of their calculation is several times lower than the Ideal Rigid Body line shown in the corresponding compliance curves.
Is there something wrong with the compliance curve data? Not at all. This technical note explains the “discrepancy” and offers a method for reliably approximating the Ideal Rigid Body line for a table top.

Experimental Procedure Accounts for the Difference

The incongruous results arise from a difference in where the force is applied to a table top and where the response of the structure is measured.
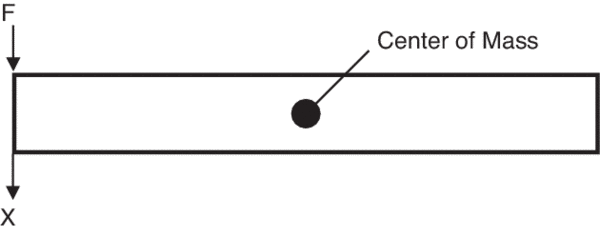
The force was applied and measured at the center of the object (Figure 2). When a table top is measured experimentally using this method, the calculated value for the Ideal Rigid Body line does indeed match the experimental performance of the tables.

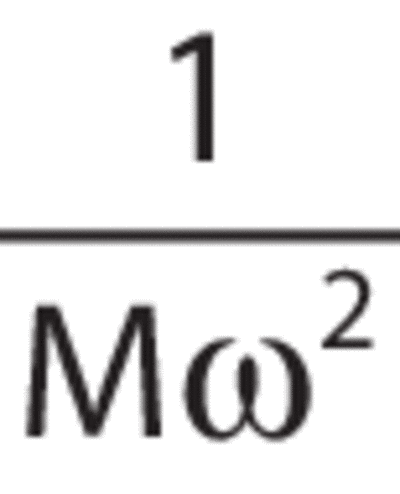
The idealized 1/Mω2 formula assumes the force is applied and measured at the center of the rigid structure
Figure 2. The idealized 1/Mω2 formula assumes the force is applied and measured at the center of the rigid structure.

However, it is common knowledge that the compliance of a table top is worst at its edges and therefore all reputable suppliers of vibration-control systems apply the force at the edge and monitor the response of the table at the same location (Figure 3).

In practice, table top compliance is tested by striking the table edge, and measuring table top response in the same location
Figure 3. In practice, table top compliance is tested by striking the table edge, and measuring table top response in the same location.

But when the compliance is measured in this manner, there are actually two components of the rigid body motion in response to the applied force: 1) Center-of-Mass Motion - Identical to the response of the table as if the force were applied at the center of the table

(i.e.)

and 2) Rotational Motion - Due to the torque exerted on the table when the force is applied.

Quantifying Table Top Rotation

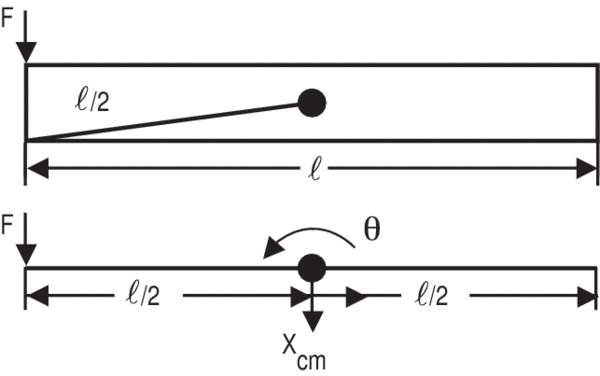
Rotational component of a table top approximated as a rigid rod
Figure 4. Rotational component of a table top approximated as a rigid rod.

We can approximate the rotational component by modeling the table as a rigid rod. The torque applied to the rod by a force at the end (Figure 4) is:

Where:
τ = torque
F = applied force
r = radius to the center of mass
l = length of the rod
I = moment of inertia
L = angular momentum

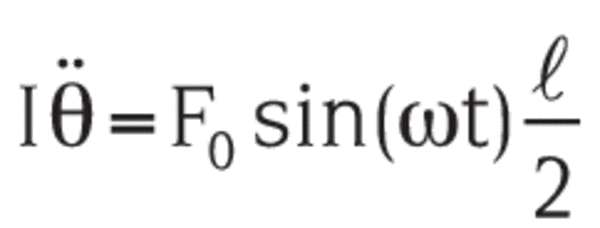
Applying a time-varying force and using r = l/2, we have:

Integrating twice, angular displacement is found:

For small linear displacements, r sin θ = r θ, so:

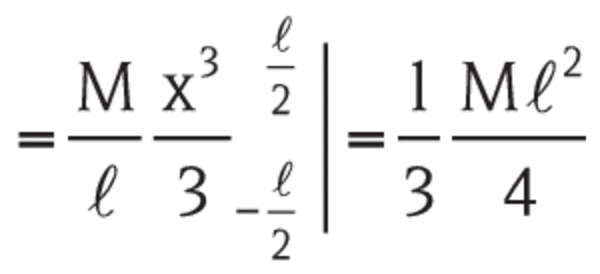
Now, we need I, the moment of inertia, for a rigid rod:

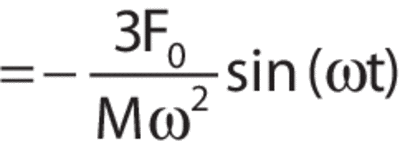
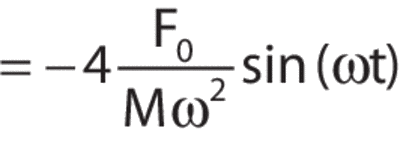
Thus, the rigid-body rotation (torque) component of the motion is:

Combined Center-of-Mass and Rigid-Body Displacement

For the force applied and displacement measured, as in Figure 3, the center-of-mass (CM) and rigid-body rotation (ROT) displacements are additive.

Thus, the total compliance for applying the force to the table edge, as in Figure 3, and measuring the response in the same location is:

This result is exactly four times the compliance value predicted by the simplified (force applied at center) model. If the force were applied at the table corner, analogous computations for a rigid plate would give:

When the Ideal Rigid Body line is approximated with these formulas, the result correlates well with the observed Ideal Rigid Body lines in experimental compliance curves.

Note: We would like to acknowledge the assistance of Dr. John Beckerle at Clemson University in preparing this technical note.