About Optical Table Performance Specifications

The Dynamic Deflection Coefficient and Relative Motion: The Most Meaningful Table Top Specifications

The dynamic rigidity of a table top (its resistance of the top surface movement from vibration) is the single most important measure of vibration control performance. But compliance curves, the classic method of measuring dynamic rigidity, do not go far enough in providing a quantitative measure of table top vibration control capabilities.

The Dynamic Deflection Coefficient, a figure of merit that can be derived from any compliance curve, enables you to compare dynamic performance directly and select an appropriate level of table stability for your application. When the ambient vibration level is known, the Dynamic Deflection Coefficient can also be used to calculate the Relative Motion value, which can then be used in selecting the most appropriate table for your application.

For easier comparison of Newport table tops, the Dynamic Deflection Coefficient and Relative Motion value for a typical lab environment are specified for all full-size tables and breadboards.

Table Top Dynamic Response to Vibration

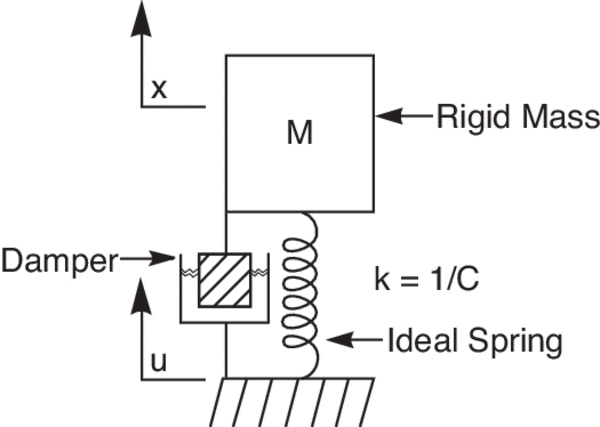
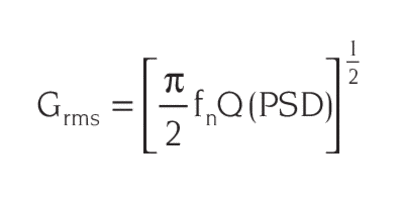
A table top is subjected to a myriad of different vibration inputs, which taken together, closely approximate random vibration. A table’s acceleration response to random vibration is given by:

(1)

Where:

Grms is rms acceleration response

fn is the table’s corresponding resonant frequency (Hz)

Q is the maximum amplification at resonance, a measure of damping efficiency (dimensionless), and

PSD is the applied power spectral density (g2/Hz)

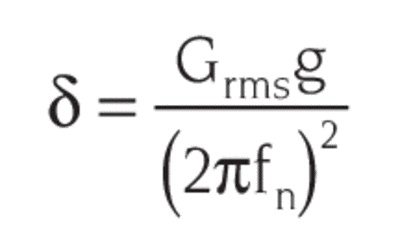
The relative displacement response of the table top is given by:

(2)

Where:

δ is the displacement response

g is the acceleration due to gravity

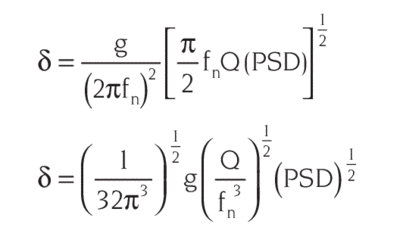
Combining equations (1) and (2) yields the displacement response of a table top to random vibration:

(3)

The Relative Motion Formula

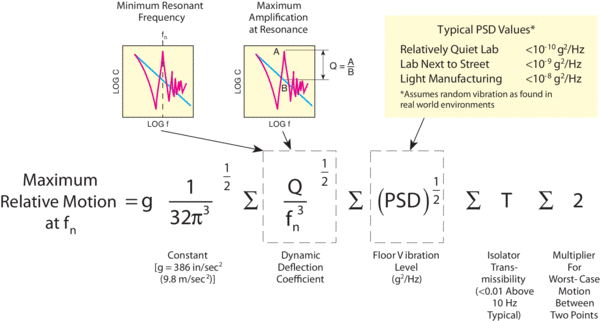
Equation 3, the basis for the Relative Motion Formula in Figure 1, enables you to calculate the worst-case relative motion between two points on a table at the natural frequency (fn). Calculated results agree closely with measured performance generated by interferometric methods. For your convenience, Newport also provides a calculated Relative Motion value for all tables and breadboards, which accurately reflects performance in a typical quiet laboratory environment.

The second term of the Relative Motion equation, (Q/fn3)1/2, is the Dynamic Deflection Coefficient, a figure of merit derived from the table top’s minimum resonant frequency and damping efficiency, which together quantify the table top’s dynamic performance. The third term, (PSD)1/2, is the contribution of the applied vibration intensity level, which can be measured directly or estimated using the table (random vibration is assumed). Isolator transmissibility, the fourth term, accounts for the attenuation of ground vibrations at the frequency range of interest through the support structure.

Note that this formula is a worst-case estimate of relative motion, and that the actual relative motion experienced in most typical installations will be less. On the other hand, if the applied vibration includes sharp peaks at certain frequencies (i.e., non-random vibration), the actual relative motion may be considerably higher.

Example:

Calculate the worst-case (or maximum) Relative Motion value (RM) between two points on a 4 ft x 8 ft x 12 in. (1200 x 2400 x 305 mm) RS 2000™ table top installed in a lab near a street. Please see Research Grade Optical Tables for the compliance curve.

First of all, find the maximum Dynamic Deflection Coefficient.

For the resonance peak at:

fn ≈ 190 Hz, Q ≈ 2.7, (Q/fn3)1/2 ≈ 0.6 x 10⁻³.

For the resonance peak at:

fn ≈ 270 Hz, Q ≈ 22, (Q/fn3)1/2 ≈ 1.1 x 10⁻³.

Assume

g = 386 in./sec2

PSD = 10-9 g2/Hz

T <0.01 at typical frequency range of interest

Then the relative motion:

About the Deflection Under Load Specification

After dynamic rigidity, the static rigidity of a table top is the most important performance specification. Static rigidity corresponds to the intuitive concept of stiffness and is measured by static deflection, the amount of downward “sag” of the table top between its support points when a static load is placed on the table top.

A small deflection means that components will remain better aligned on the table, especially when heavy loads are placed on the table or are moved. Static rigidity is also an important factor in the table top’s dynamic response to low-frequency vibrations.

Using the formula provided, you can accurately predict the deflection in the center of the table for a given point load. For comparison purposes, Newport provides a Deflection Under Load specification for all full-sized tables and breadboards based on a 250 lb (114 kg) load.

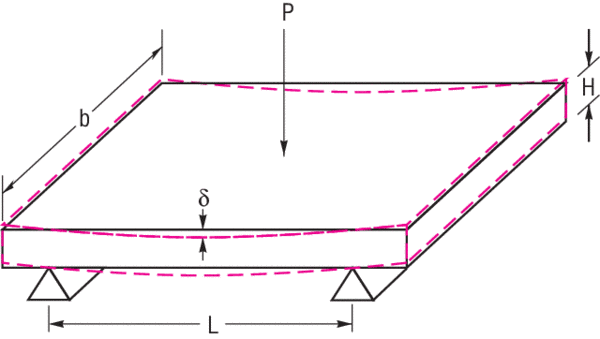
In the case of a table supported by isolators in the recommended location (22% from the table ends) and an incremental point load applied halfway in between, the downward deflection at the center of the table (Figure 2) is given by:

Where:

P = force exerted by a point load

L = length of span between isolators (length of table x 0.56)

b = width of table

H = thickness of table

T = thickness of skins

E = Young’s modulus of the skin material

G = shear modulus of the core

Formula for determining the maximum relative motion between two points on an isolated table top from any compliance curve
Figure 1. Formula for determining the maximum relative motion between two points on an isolated table top from any compliance curve. Table tops supported by rigid stands (or legs) would have a larger relative motion value.

The first term in the equation is the contribution from bending and is largely a function of the skin properties, while the second term is the contribution due to shear, which is primarily dependent on the properties of the core.

Static deflection for a point load P applied at the center of a panel supported at the recommended isolator locations
Figure 2. Static deflection for a point load P applied at the center of a panel supported at the recommended isolator locations.

All table and breadboard material constants are readily available in the table and breadboard sections, with the exception of the Young’s Moduli, which are supplied in the following table.

Young’s Moduli of Skin Materials:

Carbon Steel 29.0 x 10⁶ psi (200 GPa)
Stainless Steel 29.0 x 10⁶ psi (200 GPa)
Super Invar 6061-T6 21.5 x 10⁶ psi (148 GPa)
Aluminum 9.9 x 10⁶ psi (69 GPa)
Granite 7.0 x 10⁶ psi (48 GPa)

Example:

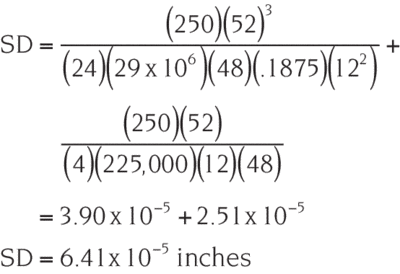
Static Deflection (SD) under a 250-lb load for a 4 ft x 8 ft x 12 in. (1200 x 2400 x 305 mm) RS 4000™ table top is given by:

P = 250 lb

L = 52 in. span

E = 29,000,000 psi

b = 48 in.

T = 0.1875 in.

H = 12 in.

G = 225,000 psi

Footnotes