Compliance Testing Services

Newport can provide compliance testing on all of our honeycomb tables and other structural products. This data, though not as comprehensive as modal analysis, can aid in identifying the dominant modes of the structure. Knowing the dynamic response of the table can assist the researcher in better planning for testing activities. Below is a general description of compliance testing using the impulse method.

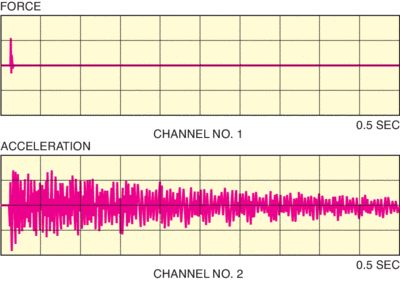
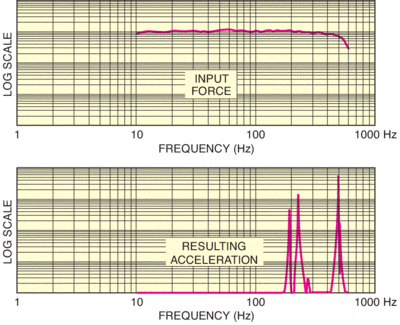
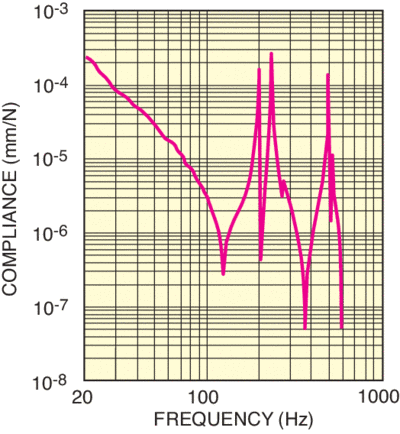
Consider a 4 x 10 ft. x 8 in. (1200 x 3000 x 200 mm) thick granite plate supported on four isolation mounts. The table is struck with a small hammer equipped with a force-measuring transducer. An accelerometer is attached to the table surface directly adjacent to the point of impact of the hammer. Figure A shows the measured input force (upper curve) and resulting acceleration of the granite. Figure B shows the frequency spectral analysis of the force and acceleration obtained by digital processing of the data. Figure C shows the compliance curve obtained by converting the acceleration data to equivalent displacement values (which scale as the inverse square of the frequency) and taking the displacement-to-force ratio. One notable point of these curves is that the baseline compliance curve falls off rapidly with increasing frequency, so for inputs with a broad range of frequencies, the largest resulting displacements are inevitably caused by one of the lower frequency resonances.

Obviously, the measured curve depends upon the location of the measurement. In general, the compliance data taken at other locations will exhibit the same resonant frequencies but with different amplitudes. This is because the motions associated with the resonance have different amplitudes and phase at different locations.

Granite Force Accel-S
Figure A: Input force and resulting acceleration for a granite surface plate supported on four isolation mounts.
Granite Freq Spectra-S
Figure B: Frequency spectra of the input force and acceleration for the granite surface plate.
Comp3 Granite-S
Figure C: Compliance curve of granite surface plate 1200 x 3000 x 200 mm (4 ft x 10 ft x 8 in.)

At Newport, special compliance and vibration measurement equipment has been developed for testing tables under design and custom construction. The accelerometer data is digitized and computer analyzed to generate compliance curves, as well as time and frequency domain data. For field use, we have also developed a special portable compliance and vibration analyzer. Please contact our technical staff if you have any questions or if we can be of service in evaluating the environmental vibration sources in your lab.