Tunable Lasers Applications to Spark Your Imagination

Mode-Hop-Free Tuning and Narrow Linewidths for Swept-Frequency Measurements

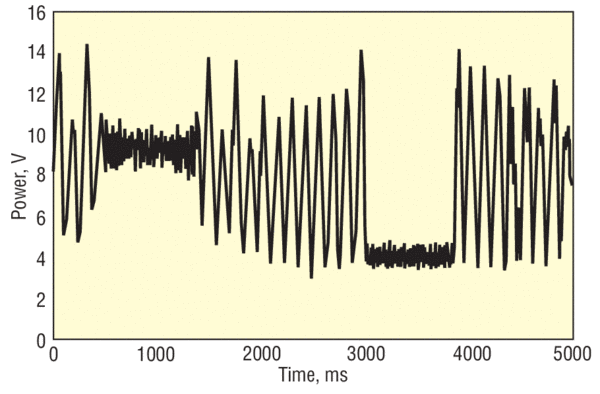
Interferometry is widely used to make precision length and displacement measurements ranging from less than a nanometer to tens of meters. Researchers used our 630-nm TLB-6304 laser to perform these types of precision measurements. The graph below shows a wavelength scan of a short-path-length interferometer (a couple of centimeters). The interferometer fringes are smooth and evenly spaced, demonstrating that the laser is operating single mode and mode-hop free over the entire tuning range. The phase-continuous (mode-hop-free) tuning over a wide tuning range allows high-resolution measurements over large distances.

Swept-wavelength measurement of an unbalanced interferometer
Figure 1. Swept-wavelength measurement of an unbalanced interferometer. The scanning range was 5 nm with a path-length difference of a few millimeters.

FM Locking and Nonlinear Generation

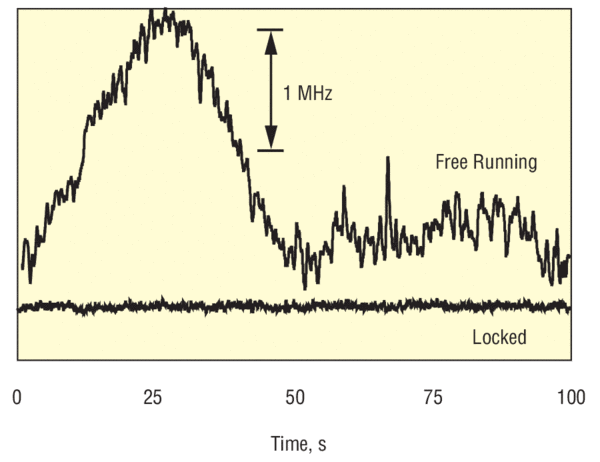
Researchers have used one of our lasers locked to the atomic lines of rubidium and potassium to create frequency standards at 1550 nm. In their setup, the output of the external-cavity diode laser at 1550 nm was frequency doubled in a periodically poled LiNbO3 waveguide, then injected into a cell containing either rubidium or potassium vapor. By dithering the laser frequency, wavelength-modulation spectroscopic techniques were used to create an error signal that was then fed back to the laser to stabilize the laser's output frequency. Such techniques are important in developing frequency standards for dense wavelength-division-multiplexed (DWDM) optical-communication and fiber-optic sensing systems.

This graph compares the frequency noise of a tunable laser without any feedback control to the same laser when actively stabilized to a sub-Doppler absorption line of rubidium
Figure 2. This graph compares the frequency noise of a New Focus™ laser without any feedback control to the same laser when actively stabilized to a sub-Doppler absorption line of rubidium.
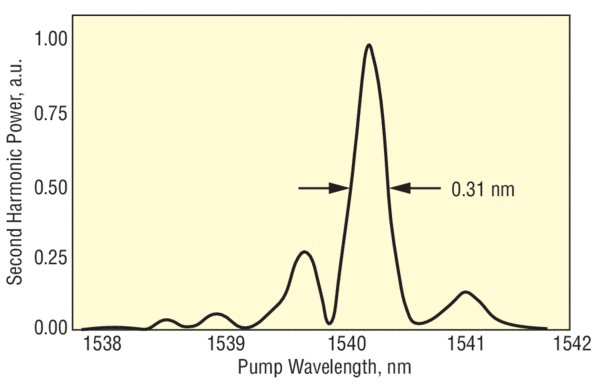
This phase-matching curve was generated in a periodically poled LiNbO3 waveguide doubler using a New Focus laser at 1540 nm
Figure 3. This phase-matching curve was generated in a periodically poled LiNbO3 waveguide doubler using a New Focus laser at 1540 nm.

Absolute Frequency Measurements

Absolute frequency measurements can be a challenge, but they can be aided significantly by commercially available tunable diode lasers. A team at JILA/NIST has used nonlinear optics to compare the UV sum frequency generated from the output of a doubled Nd:YAG laser mixed with the 778-nm Ti:Sapphire light with the UV frequency obtained by doubling a stabilized, tunable 632-nm diode laser. Effectively this experiment measures the 532-nm frequency of an iodine reference transition in terms of known standards at 633 nm and 778 nm. The international team included French, Russian, Japanese, Australian, and Chinese scientists, in addition to University of Colorado students and postdocs. Pictured are: Scott Diddams (JILA/NIST), Bruce Tiemann (CU), and Lei Hong (from NIST's sister organization, NRLM, in Tsukuba, Japan).

FM Spectroscopy with our TLB-7000 and TLB-6000 Tunable Lasers

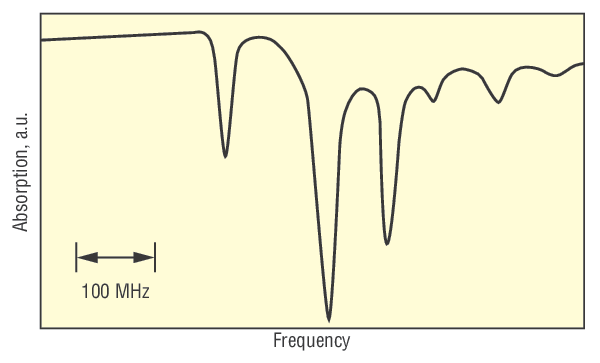
The TLB-7000 and TLB-6000 lasers are ideal for frequency-modulation (FM) spectroscopy—a powerful laser-spectroscopic technique that can achieve a high signal-to-noise ratio with a relatively simple experiment. A typical setup is shown at right. In the simplest FM spectroscopy experiment, a laser beam is transmitted through a gas cell containing an atomic or molecular vapor. The wavelength of this continuous wave laser is modulated at a particular frequency through direct frequency modulation. As the wavelength is scanned across the atomic transition, the frequency modulation is converted into amplitude modulation through the optical absorption of the beam. In the case of the TLB-7000 and TLB-6000, this is easily achieved with the frequency-modulation input. A Doppler-free saturated absorption spectrum, taken using a TLB-6000 laser, is shown in the graph below.

This graph shows Doppler-free absorption lines of rubidium obtained with a TLB-6000 laser
Figure 4. This graph shows Doppler-free absorption lines of rubidium obtained with a TLB-6000 laser and a Nirvana auto-balanced photoreceiver.