Phase-Shifting Interferometry for Determining
Optical Surface Quality

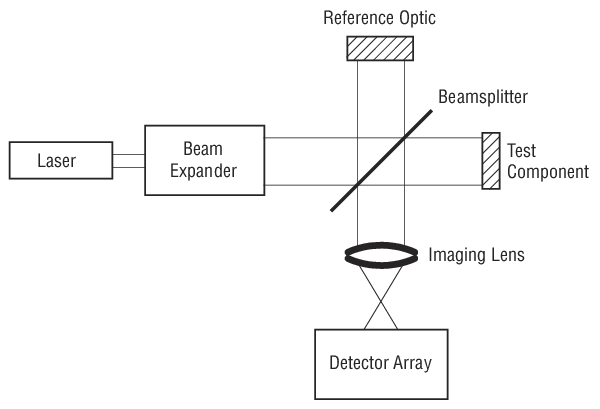
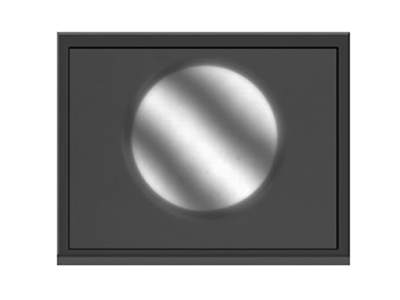
Determining the surface quality of a critical component, the deviation from the intended shape whether flat, spherical, etc.is crucial to high-precision manufacturing. Traditional methods consist of an interferometer, for example a Twyman-Green interferometer (pictured below) that compares the test optic to a reference. Differences in optical path length between the two arms of the interferometer lead to fringes in the photodetector typically a CCD array. Points lying on the same fringe center are at an equal optical path-length difference while points on adjacent centers represent a difference of a half wavelength. Introducing a small tilt between the reference and test optic results in an interferogram where any deviation from an evenly spaced straight fringe implies an aberration in the test component, as shown below.

Typical configuration of a Twyman-Green interferometer
Figure 1. Typical configuration of a Twyman-Green interferometer.

While analyzing interferograms is an extremely powerful technique, there are a few disadvantages. Finding the location of the fringe centers, which ultimately limits the accuracy of the technique, is a difficult task, and any intensity variations across the interferogram or sensitivity variations in the photodetector introduce spurious errors. Another drawback is that data is obtained only along the fringe centers not on the regularly spaced grid that many analysis routines demand. Lastly, since a few widely spaced fringes can be measured more accurately than many closely spaced ones, there is a tradeoff between resolution and the number of data points.

Phase-shifting interferometry overcomes these limitations. First, phase-shifting interferometry does not rely on finding the fringe centers. Second, measurements can be taken at every element in the photodetector array directly yielding optical path-length differences on a regularly spaced grid.

The concept behind phase-shifting interferometry is to apply a time-varying phase shift between the reference and test wavefronts. This can be achieved, for example, by mounting the reference optic on a linear transducer, such as a piezoelectric crystal. If the relative phase-shift, a, is linear in time, the intensity at every point in the photodetector array, l, will change sinusoidally with timel(x, y, t)=B(x, y)+A(x, y) cos[f(x, y)+a(t)] where the bias level, B, and modulation amplitude, A, are unknown and the optical phase difference between the test and reference optic, f, is the quantity to be measured. f is related to the height errors of the test optic, h, by f=4ph/l where l is the laser wavelength. Since there are three unknowns, measurement of at least three interferograms at known phase differences is needed to determine f. For example, by taking data at a=0, p/2, p, and 3p/2, one can compute the phase difference at every point by the simple formula f(x, y)=tan–1[(I4(x, y)–I2(x, y))/(I1(x, y)–I3(x, y))],where I1…I4 are the intensities measured at every photodetector element at times corresponding to the phase shifts a=0…3p/2. Since the calculation is performed at every point, variations in intensity and photodetector sensitivity are not issues.

While many phase-shifting interferometers use HeNe lasers as the source, using an external-cavity tunable diode laser such as the TLB-7000 provides significant advantages. First, the laser wavelength can be chosen to exactly match the operating wavelength of the optics, of particular value when the optics are coated and may not be reflective at 633 nm. Second, the time-varying phase shift can be achieved by unbalancing the two arms and varying the laser wavelength, eliminating the need for a linear actuator to translate the reference optic. When using a tunable laser, the phase shift is given by a=2. OPD Dl/l2,where OPD is the optical path length difference between the two arms of the interferometer, l is the laser's center wavelength, and Dl is the time-varying wavelength change. Therefore using a tunable diode laser such as the TLB-7000 enables measurements, and increases the speed of the measurement.

Bright and dark fringes of an interferogram
Figure 2. Bright and dark fringes of an interferogram.