Diffraction Grating Anomalies

In 1902. R. W. Wood observed that the intensity of light diffracted by a grating generally changed slowly as the wavelength was varied, but occasionally a sharp change in intensity was observed at certain wavelengths.104 Called anomalies, these abrupt changes in the grating efficiency curve were later categorized into two groups: Rayleigh anomalies and resonance anomalies.

Rayleigh Anomalies

Lord Rayleigh predicted the spectral locations where a certain set of anomalies would be found: he suggested that these anomalies occur when light of a given wavelength λ' and spectral order m' is diffracted at |β| = 90° from the grating normal (i.e., it becomes an evanescent wave, passing over the grating horizon). For wavelengths λ < λ', |β| < 90°, so propagation is possible in order m' (and all lower orders), but for λ > λ' no propagation is possible in order m' (but it is still possible in lower orders). Thus, there is a discontinuity in the diffracted power vs. wave-length in order m' at wavelength λ, and the power that would diffract into this order for λ > λ' is redistributed among the other propagating orders. This causes abrupt changes in the power diffracted into these other orders.

These Rayleigh anomalies, which arise from the abrupt redistribution of energy when a diffracted order changes from propagating (|β| < 90°) to evanescent (|β| > 90°), or vice versa, are also called threshold anomalies.

Resonance Anomalies

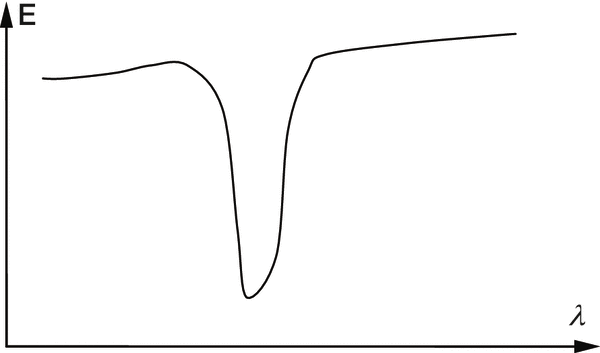
The second class of anomalies, which are usually much more noticeable than Rayleigh anomalies, are caused by resonance phenomena, the most well-known of which are surface excitation effects. At the interface between a dielectric and a metal, there are specific conditions under which a charge density oscillation (called a surface plasma wave) can be supported, which carries light intensity away from the incident beam and therefore decreases the diffraction efficiency of the grating. The efficiency curve would show a sharp drop in intensity at the corresponding conditions (see Figure 9-20).

Figure 9-20. A typical (simplified) efficiency curve showing a sharp drop where the conditions are met for surface plasmon resonance. The curve over this narrow spectral region would appear to increase monotonically if the resonance condition were not met.

For a resonance anomaly to exist, a resonance condition must be met – this places restrictions on the wavelengths (and incidence angles) that will exhibit resonance effects for a given groove profile and refractive indices. This results from the fact that in this phenomenon – the surface plasmon resonance (SPR) effect – the electromagnetic field that propagates along the metal-dielectric interface extends into each medium, so the characteristics of this propagating wave depend on the material conditions near the interface. This useful feature of SPR has led to its use in several sensing applications, such as biosensing and gas sensing. SPR can also be used to characterize the surface profile of the grating itself, especially by probing the diffraction effects due to higher harmonics in the periodic structure on the grating surface.

While diffraction gratings generally do not convert incident P-polarized light to S-polarized light (or vice versa) upon diffraction, it has been observed that such polarization conversion can occur if the grating is not illuminated in the principal plane (i.e., ε ≠ 0 in Eq. (2-3)). In this case, called conical diffraction (see The Grating Equation), resonance effects can lead to a strong polarization conversion peak (e.g., a sharp trough in the S-polarized efficiency curve coincident with a sharp peak in the P-polarized efficiency curve).


Diffraction Gratings Handbook Cover

For footnotes and additional insights into diffraction grating topics like this one, download our free MKS Diffraction Gratings Handbook (8th Edition)

Download a Handbook