High-efficiency gratings are desirable for several reasons. A grating with high efficiency is more useful than one with lower efficiency in measuring weak transition lines in optical spectra. A grating with high efficiency may allow the reflectivity and transmissivity specifications for the other components in the spectrometer to be relaxed. Moreover, higher diffracted energy may imply lower instrumental stray light due to other diffracted orders, as the total energy flow for a given wavelength leaving the grating is conserved (being equal to the energy flow incident on it minus any scattering and absorption).
Control over the magnitude and variation of diffracted energy with wavelength is called blazing, and it involves the manipulation of the micro-geometry of the grating grooves. As early as 1874, Lord Rayleigh recognized that the energy flow distribution (by wavelength) of a diffraction grating could be altered by modifying the shape of the grating grooves.84 It was not until four decades later that R.W. Wood showed this to be true when he ruled a grating on which he had controlled the groove shape, thereby producing the first deliberately blazed diffraction grating.
The choice of an optimal efficiency curve for a grating depends on the specific application. For some cases the desired instrumental response is linear with wavelength; that is, the ratio of intensity of light and the electronic signal into which it is transformed is to be nearly constant across the spectrum. To approach this as closely as possible, the spectral emissivity of the light source and the spectral response of the detector should be considered, from which the desired grating efficiency curve can be derived. Usually this requires peak grating efficiency in the region of the spectrum where the detectors are least sensitive; for example, a visible-light spectrometer using a silicon detector would be much less sensitive in the blue than in the red, suggesting that the grating itself be blazed to yield a peak efficiency in the blue.
A typical efficiency curve (a plot of absolute or relative diffracted efficiency vs. diffracted wavelength λ) is shown in Figure 9-1. Usually such a curve shows a single maximum, at the peak wavelength (or blaze wavelength) λB. This curve corresponds to a given diffraction order m; the peak of the curve decreases in magnitude and shifts toward shorter wavelengths as |m| increases. The efficiency curve also depends on the angles of use (i.e., the angles of incidence and diffraction). Moreover, the curve depends on the groove spacing d (more appropriately, on the di-mensionless parameter λ/d) and the material with which the grating is coated (for reflection gratings) or made (for transmission gratings).
 Over 8,000 products in-stock! & FREE 2-Day shipping on all web orders!* Learn More FREE T-Shirt with orders $250+ Details
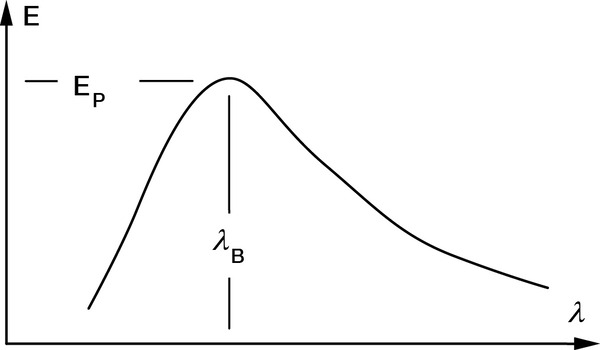
 Ultra-High Velocity