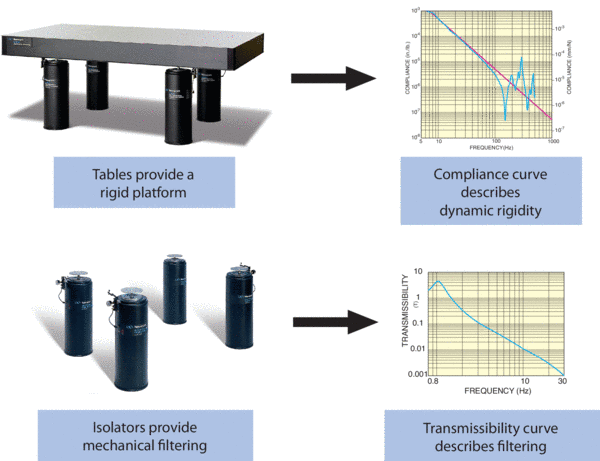
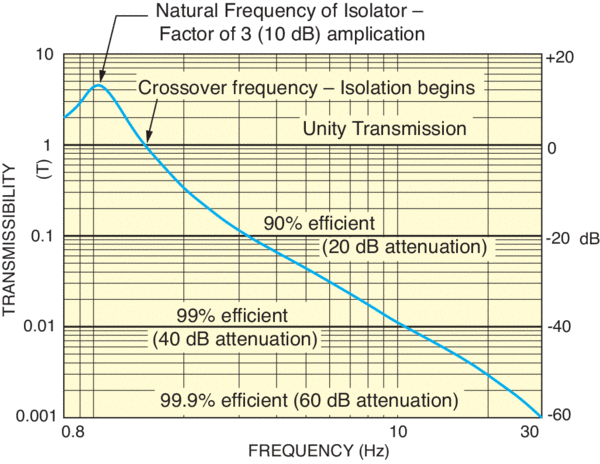
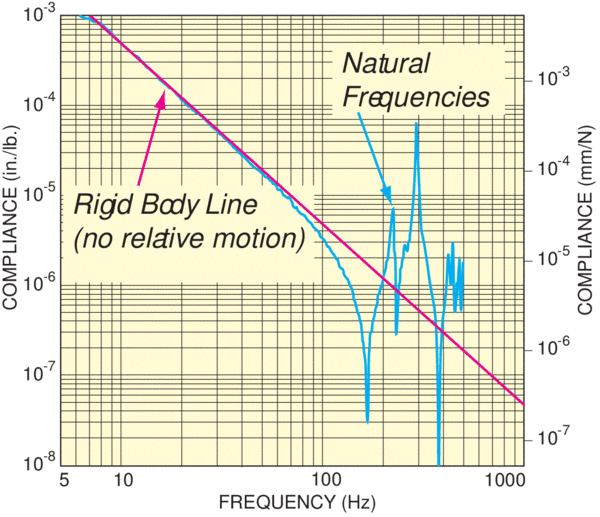
However, at higher frequencies discontinuities appear along the curve. These peaks represent the amplitudes of the natural modes of the table. The first dominant resonance may be the torsional or bending mode; other modes and harmonics will follow after the dominant modes. The reason honeycomb is preferred over granite in many applications is that the higher stiffness-to-weight ratio produces resonance modes at higher frequencies.
For a given force input granite may move less as a rigid body at low frequencies when compared to honeycomb, but the natural modes of the honeycomb are usually much higher in frequency. Moving these modes to higher frequencies offers three primary advantages:
- Less environmental vibration is usually present at higher frequencies
- A given acceleration (force) produces less displacement (deflection) at higher frequencies
- Isolation systems are more effective at higher frequency
The compliance curve also gives information about the damping built into the structure. Damping reduces the amplitude of the relative motion across the table work surface. If the peaks are very sharp, little damping is present. In general, honeycomb structures have more inherent damping than granite structures. As a result, even though a granite structure may have lower absolute compliance than a honeycomb structure, the damped honeycomb structure generally has less relative motion between points on its surface. Honeycomb tables offer different flavors of damping. Broadband damping techniques are somewhat effective at reducing relative motion across a wide frequency band. Narrowband damping techniques can virtually eliminate a natural mode (or modes) altogether. For a damped table, the compliance curves exhibit rounder, less prevalent discontinuities.
- What Compliance Curves Tell You Compliance curves tell you the frequency range over which the optical table acts as an essentially rigid body. The curve also provides the frequency of primary resonance modes and an indication of their relative amplitudes.
- What Compliance Curves Don’t Tell You Compliance curves only give the response at the points measured—not at all points where optical components will be mounted. The most effective measure of worst case deflection for rectangular structures is to place the sensor at the center of the table and/or in the corners. These measure the dominant torsional and bending modes. If the sensors are placed at antinodes (where little motion is present), even a poorly designed structure will look very good. For this reason some manufacturers will not offer compliance curves while others are quite liberal in their sensor placement.
Compliance curves also do not provide any information about static deflection, surface damping effects, table flatness, internal stresses and thermal response characteristics. These measures must be obtained from the manufacturer or measured in-situ in the application.
 Over 8,000 products in-stock! & FREE 2-Day shipping on all web orders!* Learn More FREE T-Shirt with orders $250+ Details


 Ultra-High Velocity