Compliance and Transmissibility Curves
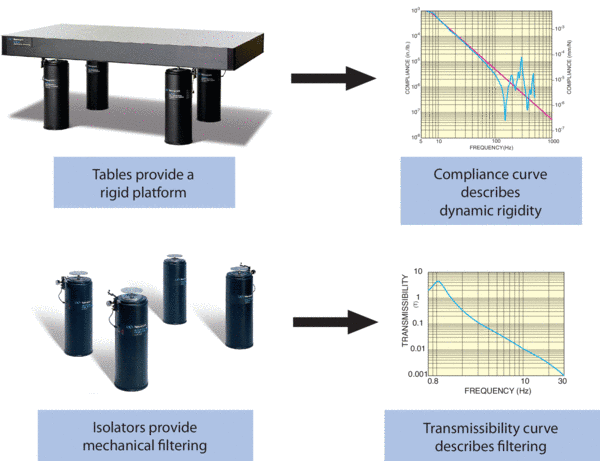
The primary goal of an optical table system is to eliminate relative motion between position sensitive components across the table work surface. The vibration isolator system is designed to filter floor vibration before it can reach the table top and disturb an optical beam path. The honeycomb structure of the optical table is designed to rigidly resist deflection from moving loads or any vibration that passes through the isolation system.
Optical table systems can be characterized by compliance curves for the optical table and transmissibility curves for the isolation system. Taken together, these two plots show the primary performance capabilities of the optical table system.
- The transmissibility curve shows the mechanical filtering properties for the isolator leg—in other words, it gives an indication of how much floor vibration will be transmitted through the leg to the table top. It is a relative measure given as a ratio of vibration at two points: one on the top of the isolator and one on the floor.
- The compliance curve shows the dynamic response of the table top in a free space condition—in other words, it gives an indication of how the surface will change shape in response to vibration. Compliance curves are transfer function curves that show the position response of a point on the table surface to a time variant force applied at the same point. In practice the force is generally applied with a calibrated hammer, which outputs a signal proportional to the force with which it hits the table.
Vibration isolators provide increased isolation as the frequency increases. However, at very low frequencies pneumatic isolators can amplify and therefore increase the vibration level of the system. Conversely, at lower frequencies the honeycomb optical table is dynamically rigid. Although it will move as a monolithic structure in inertial space, it will not deflect and allow relative motion across the work surface. However, at high frequencies the natural resonance modes of the table structure will allow amplified deflection across the table. Fortunately, the regions where the table will deflect the isolators are highly efficient at filtering vibration. Therefore, it is the goal of the optical table designer to:
- Design an isolator that begins isolating as low in frequency as possible to maximize the high frequency filtering effects.
- Design a honeycomb table that begins resonating at as high a frequency as possible to minimize possible excitation from floor vibration.
Newport’s Stabilizer pneumatic isolator designs, trussed honeycomb core and narrowband vibration absorber tuned damping technology are all directed towards total elimination of work surface deflection.
Transmissibility Curves
The figure below shows a transmissibility curve of a pneumatic isolator. At 0 Hz the curve initiates at unity (or 0 dB) vibration transmission. In other words, the isolation leg is essentially rigid at very low frequency and any vibration amplitudes are exactly transmitted to the table top.
The curve then begins to rise and peaks at 1–2 Hz. This is the natural frequency of the isolator. Anywhere on the plot where the curve is above unity transmission the isolator is increasing the vibration level before it reaches the table. The peak signifies the maximum amplification of the isolator design. Lightly damped isolators will exhibit a tall, sharp peak; heavily damped isolators will exhibit a lower amplitude, rounder peak. At the natural frequency of most optical table isolators vibration is amplified by a factor of 3 to 4 (10–12 dB).
As the frequency increases beyond the isolator resonance, it begins to fall sharply. Once the isolator transmissibility curve falls below unity transmission, it begins to “isolate.” The isolation crossover point is approximately 1.4 times the isolator resonance frequency. As the curve rapidly descends, the high pass mechanical filter becomes more and more efficient. By 10 Hz most pneumatic isolators are filtering greater than 90% of the floor vibration. By 100 Hz almost 99% of the vibration is filtered!
- What Transmissibility Curves Tell You
Transmissibility curves tell you how much vibration is transmitted at a given frequency at amplitude levels above the frictional limitations of the isolator. These curves also give some indication of the damping present in the design.
- What Transmissibility Curves Don’t Tell You
Transmissibility curves don’t give any real information about settling time, repositioning accuracy and diaphragm life. These must be obtained from the manufacturer or measured in-situ on the actual application.
Compliance Curves
The following figure shows the compliance curve of a honeycomb table. The compliance curves show the positional motion of the structure for a given excitation force and frequency. Beginning at 0 Hz the curve slopes downward without discontinuities until several hundred Hz. The region where the slope is straight is called the “Rigid Body Line”. Throughout this region, the optical table is rigid and exhibits no relative motion across the surface. The position of the curve may change depending on the weight of the structure, but the slope is physically determined. The slope of 40 dB per decade is given kinematically by the relationship between acceleration (caused by the input force) and the resulting position change. For a given level of excitation, a heavier granite table will exhibit less motion as a monolithic structure in inertial space than a lighter honeycomb structure, but along the straight portion of either curve the relative deflection will remain the same—zero. And excepting gross changes in absolute position, it is the elimination of relative motion between components in the setup that the optical researcher seeks.
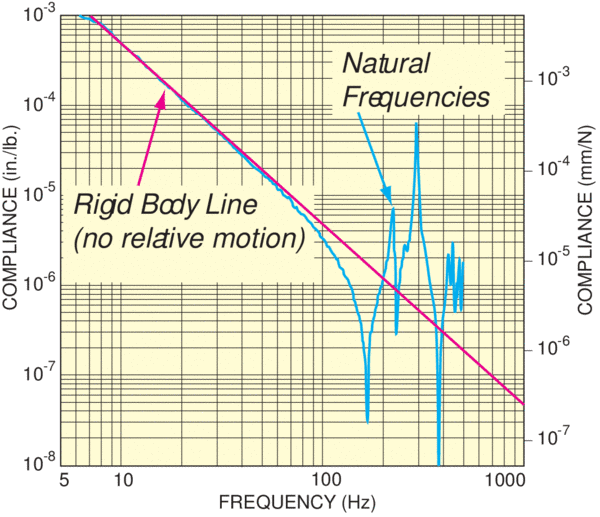
However, at higher frequencies discontinuities appear along the curve. These peaks represent the amplitudes of the natural modes of the table. The first dominant resonance may be the torsional or bending mode; other modes and harmonics will follow after the dominant modes. The reason honeycomb is preferred over granite in many applications is that the higher stiffness-to-weight ratio produces resonance modes at higher frequencies.
For a given force input granite may move less as a rigid body at low frequencies when compared to honeycomb, but the natural modes of the honeycomb are usually much higher in frequency. Moving these modes to higher frequencies offers three primary advantages:
- Less environmental vibration is usually present at higher frequencies
- A given acceleration (force) produces less displacement (deflection) at higher frequencies
- Isolation systems are more effective at higher frequency
The compliance curve also gives information about the damping built into the structure. Damping reduces the amplitude of the relative motion across the table work surface. If the peaks are very sharp, little damping is present. In general, honeycomb structures have more inherent damping than granite structures. As a result, even though a granite structure may have lower absolute compliance than a honeycomb structure, the damped honeycomb structure generally has less relative motion between points on its surface. Honeycomb tables offer different flavors of damping. Broadband damping techniques are somewhat effective at reducing relative motion across a wide frequency band. Narrowband damping techniques can virtually eliminate a natural mode (or modes) altogether. For a damped table, the compliance curves exhibit rounder, less prevalent discontinuities.
- What Compliance Curves Tell You Compliance curves tell you the frequency range over which the optical table acts as an essentially rigid body. The curve also provides the frequency of primary resonance modes and an indication of their relative amplitudes.
- What Compliance Curves Don’t Tell You Compliance curves only give the response at the points measured—not at all points where optical components will be mounted. The most effective measure of worst case deflection for rectangular structures is to place the sensor at the center of the table and/or in the corners. These measure the dominant torsional and bending modes. If the sensors are placed at antinodes (where little motion is present), even a poorly designed structure will look very good. For this reason some manufacturers will not offer compliance curves while others are quite liberal in their sensor placement.
Compliance curves also do not provide any information about static deflection, surface damping effects, table flatness, internal stresses and thermal response characteristics. These measures must be obtained from the manufacturer or measured in-situ in the application.