Characterization of Diffraction Grating Imaging Quality

In Concave Diffraction Gratings, we formulated the optical imaging properties of a grating system in terms of wavefront aberrations. After arriving at a design, though, this approach is not ideal for observing the imaging properties of the system. Two tools of image analysis – spot diagrams and linespread functions – are discussed below.

Geometric raytracing and spot diagrams

Raytracing (using the laws of geometrical optics) is superior to wavefront aberration analysis in the determination of image quality. Aberration analysis is an approximation to image analysis, since it involves expanding quantities in infinite power series and considering only a few terms. Raytracing, on the other hand, does not involve approximations, but shows (in the absence of the diffractive effects of physical optics) where each ray of light incident on the grating will diffract. It would be more exact to design grating systems with a raytracing procedure as well, though to do so would be computationally cumbersome.

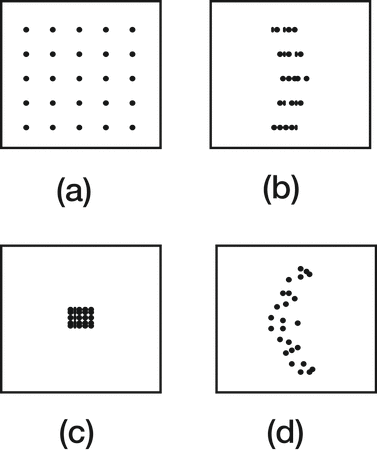
The set of intersections of the diffracted rays and the image plane forms a set of points, called a spot diagram. In Figure 8-1, several simple spot diagrams are shown; their horizontal axes are in the plane of dispersion (the tangential plane), and their vertical axes are in the sagittal plane. In (a) an uncorrected (out-of-focus) image is shown; (b) shows good tangential focusing, and (c) shows virtually point-like imaging. All three of these images are simplistic in that they ignore the effects of line curvature as well as higher-order aberrations (such as coma and spherical aberration), which render typical spot diagrams asymmetric, as in (d).

Figure 8-1. Spot diagrams. In (a) the image is out of focus. In (b), the image is well focused in the tangential plane only; the line curvature inherent to grating-diffracted images is shown. In (c) the image is well focused in both directions – the individual spots are not discernible. In (d) a more realistic image is shown.

A straightforward method of evaluating the imaging properties of a spectrometer at a given wavelength is to measure the tangential and sagittal extent of an image (often called the width w' and height h' of the image, respectively).

Geometric raytracing provides spot diagrams in good agreement with observed spectrometer images, except for well-focused images, in which the wave nature of light dictates a minimum size for the image. Even if the image of a point object is completely without aberrations, it is not a point image, due to the diffraction effects of the pupil (which is usually the perimeter of the grating). The minimal image size, called the diffraction limit, can be estimated for a given wavelength by the diameter a of the Airy disk for a mirror in the same geometry:

α = 2.44λƒ/noOUTPUT = 2.44λ (r'λ/Wcosβ) (8-1)

Here ƒ/noOUTPUT is the output focal ratio, r'(λ) is the focal distance for this wavelength, and W is the width of the grating. Results from raytrace analyses that use the laws of geometrical optics only should not be considered valid if the dimensions of the image are found to be near or below the diffraction limit calculated from Eq. (8-1).

Linespread calculations

A fundamental problem with geometric raytracing procedures (other than that they ignore the variations in energy density throughout a crosssection of the diffracted beam and the diffraction efficiency of the grating) is its ignorance of the effect that the size and shape of the exit aperture has on the measured resolution of the instrument.

An alternative to merely measuring the extent of a spectral image is to compute its linespread function, which is the convolution of the (monochromatic) image of the entrance slit with the exit aperture (the exit slit in a monochromator, or a detector element in a spectrograph). A close physical equivalent is obtained by scanning the monochromatic image by moving the exit aperture past it in the image plane and recording the light intensity passing through the slit as a function of position in this plane.

The linespread calculation thus described accounts for the effect that the entrance and exit slit dimensions have on the resolution of the grating system.


Diffraction Gratings Handbook Cover

For footnotes and additional insights into diffraction grating topics like this one, download our free MKS Diffraction Gratings Handbook (8th Edition)

Download a Handbook