Active Vibration Damping
An optical table is a stiff platform supporting vibration–sensitive equipment. A typical optical table is a sandwich structure consisting of two faceplates and a lightweight honeycomb core. Due to high stiffness-to-weight ratio, these platforms are used in a wide variety of applications in optical research and high-precision manufacturing, usually in conjunction with soft pneumatic vibration isolators. Although good isolation from floor vibration can be achieved in these systems, the platform deviates from the ideal rigid-body behavior at natural frequencies of its flexural vibrations. These higher frequency flexural vibrations cause misalignment of optical equipment installed on the table, which leads to deterioration of the optical performance.
Dynamic properties of optical tables are usually characterized by their dynamic compliances. Dynamic compliance is a ratio of dynamic deflection to dynamic force, as a function of frequency. For a free absolute rigid body, dynamic compliance is inversely proportional to frequency squared, represented by a straight line on a logarithmic scale. Plots of dynamic compliances provide a convenient way to estimate deviations from a rigid body behavior. Figure 1 shows a typical plot of the absolute value of compliance for an optical table measured near a corner. The graph clearly shows three different areas: (1) low-frequency zone below the first resonance frequency of flexural vibration (but above the isolation frequency) where the behavior of the table is close to that of a rigid body, (2) a medium-frequency zone containing main resonances and (3) a high-frequency zone of non-resonant behavior characterized by a “background” impedance. To reduce flexural vibration of the table, it is necessary to reduce the main resonance peaks, which are usually clustered between 100 Hz and 500 Hz for the most frequently used sizes of optical tables.
Various known passive means of reducing these unwanted vibrations, such as structural damping and “wide-band” damping by auxiliary mass coupled to the table by visco-elastic compounds, have only limited effect. Dynamic vibration absorbers (tuned mass dampers) as used in high-end tables such as Newport Corporation’s RS series suppress flexural resonance vibration of the table efficiently. These tuned mass dampers can only be tuned to the tables particular resonant frequencies and can not be adjusted for significant changes to table loading.
Methods of active vibration control offer a promise of high efficiency without the restrictions of passive methods. Active vibration control involves monitoring vibrations of a structure and utilizing the vibration signal to generate a force with the proper phase and amplitude to attenuate the vibration. An additional advantage of an active approach is the ability to supply a vibration signal that can be used independently for monitoring the vibration environment
Theoretical Background
Active vibration control of multi-degree-of-freedom systems has been a subject of extensive research since the early 1990’s. For a general active multi-degree-of-freedom system, dynamic deflection at an arbitrary point, un, caused by an external excitation force, fm, can be represented in the frequency domain by
where flact are active forces created by control loops, and Gnm(ω) are dynamic compliances. It is well known that collocated sensor-actuator pairs offer a robust active feedback control system. Accordingly, consider a linear feedback system producing active forces at certain locations from the motion signals at the same locations:
where Cl(ω) are complex-valued control functions. Equations (1) and (2) form a closed system of linear equations governing the motion of the system. Dynamic compliances can be represented by the familiar modal expansion:
Here, φnk are components of the normal modes that are, for sake of simplicity, assumed real for a low-damped primary system, ωk are “undamped” natural frequencies and ηk are associated loss factors. As mentioned above, main resonance peaks present the main concern in reducing flexural vibration of optical tables. Suppose the “open-loop” dynamic response is dominated by the kth normal mode in the vicinity of its resonance frequency. Then the compliance can be approximately represented by a single member of the series (3) in the vicinity of ωk:
The linear system (1), (2) with the approximate expressions (4) substituted for dynamic compliances can be solved explicitly in the following form:
where unpassive represents the solution in absence of active forces. The equation (5) leads to two important conclusions. First, the optimal phase of the complex-valued control functions Cl(ω) is (-π/2) in the frequency range of interest. This has to be expected, because damping is known to be the most efficient way of reducing resonance vibrations. Second, the right hand side of (5) does not depend on n or m. This shows that a small number of collocated sensor-actuator pairs can damp resonance vibration throughout the structure created by any source. Based on the analysis of the typical resonance modes of anisotropic plates known in the literature, as well as archival data of Newport Corporation, it was confirmed by testing proof-of-concept prototypes that two active dampers placed at two corners of the table would effectively reduce a few first dominant resonance modes a factor of 10.
System Architecture
Figure 2 shows the general layout of the SmartTable. Two sensor-actuator assemblies are integrated into the structure of the optical table at two corners. The design ensures rigid coupling of the sensor and the actuator, and includes a stiff tubular structure coupling the damper to both top and bottom facesheets and serving as a shield to internal electronic circuit boards. Since both actuator and sensor are electromagnetic devices, they are also shielded securely from each other. Two cables connect the dampers to the controller unit. The controller unit can communicate, over USB interface, with a PC. The software supplied with the product allows users to change the controller settings, and also collect, display and store vibration data in both time and frequency formats.
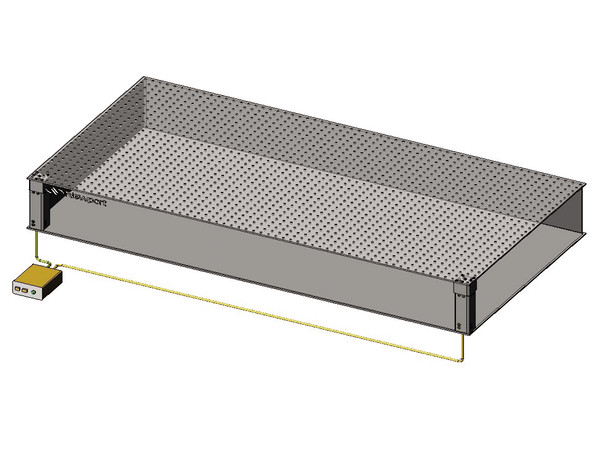
Figure 3 shows, in general terms, the feedback schematics. Each sensor-actuator pair is controlled by a separate control channel.
These control channels are shown in more detail in Figure 4
The pre-amplifiers and band-pass filters condition the sensor output signal before feeding it to the digital controller. The digital controller implements recursive filters that compensate for the dynamic response of the shaker and correct the phase to bring the phase difference between the displacement and force close to (-π/2) in the desired frequency range. This, in effect, emulates the action of a viscous damper in the frequency range of interest. The control functions include gain factors k1 and k2 that define the tradeoffs between damping performance and system stability. It is desirable to make these gains as high as possible for increasing the damping and thereby decreasing the vibration level. Nevertheless, the feedback system would become unstable if the gains were too high. The optimal gains will depend on the payload configuration. To determine the optimal gains for a given safety margin, one should know the full model of the plant (table and payload) and control circuitry, which is not practical. Even if such models were available, the optimum tuning of k1 and k2 would change because of variation in motor constants and sensitivities of sensors and actuators, in addition to variations in the parameters of electronic components. To circumvent this problem, a simple method was used for adaptive tuning the control loop gains. This method is illustrated in Figure 5. The procedure consists of the following steps.
- Initially, the first control channel is enabled and the second one is disabled.
- The first channel gain is ramped up until the onset of instability is detected by the sensor.
- After that, the gain is scaled back to stay in the stability domain.
- A converging search by bisection is used to make the procedure more precise.
- The value of the gain is stored.
- The procedure is then repeated for the second channel.
- Finally, both channels are enabled and the gains are ramped up proportionally to the stored values until instability is detected by at least one channel.
- After that, all the gains are scaled back in small proportional steps to stay in the stability domain. Again, bisection is used to make the procedure more precise.
- A safety factor is applied to the resulting gain values.
In order to maintain high signal-to-noise ratio, the Smart table control system employs auto-ranging based on the mean-square value of the feedback signal. The switching of ranges is accomplished by driving a signal that sets up the preamplifier at a desired level. Range switch is accomplished such that the signal parameters (noise, phase, bandwidth) are unmodified and only the gain is changed. The low noise preamplifier is, of course, essential for ensuring high signal quality.
If the feedback signal is at the lowest range and it still violates the desired constraints, the system is said to be in a “Vibration Overload” condition. The overload condition is also detected using an error signal generated by the signal clipping detectors in the preamplifier. The overload condition is reported to the user; the system is, however, capable of operating in overload condition, although maybe not with the same efficiency.
Test Results
The SmartTable product has endured extensive testing in the Newport vibration control and quality assurance laboratories. The performance was verified under various vibration environments, created either by on-board sources of vibration or by ambient environmental vibration sources in an adjacent production shop. Figure 6 compares the vibration spectra created by random excitation. The main resonance vibration peaks are reduced by about ten times.
Figure 7 shows the dynamic compliances of the Smart table obtained by applying random excitation (about 0.25 lb RMS) through a force sensor. The damping performance is on par with that of top-of-the-line tables containing tuned vibration absorbers. Nevertheless, if the table is loaded by a weight comparable to the weight of the table, the passive vibration absorbers can become “mistuned”, whereas the SmartTable dampers work equally well after auto-tuning
Finally, Figure 8 illustrates the effect of damping in the time domain. It shows attenuation of vibration caused by a short load pulse. The shock was applied near a corner about 10 inches from the edges of the table; the resulting vibration was monitored by an accelerometer near the center of the table