Using High-Speed Photodetectors for Pulsed-Laser Measurements

Our time-domain optimized high-speed detectors are commonly used for measuring the pulse shape of short-pulsed lasers or for generating an optical trigger signal from short optical pulses. Some important considerations must be taken into account when these types of measurements are made.

One important consideration in such measurements is the optical saturation level of the photoreceiver under pulsed-laser excitation. Saturation will begin when the output signal reaches a certain level, and for all signal types (including pulses) this level is given roughly by the cw input saturation power (Pcw) multiplied by the gain, G. For pulses much shorter than the response time of the photoreceiver the output pulse will have a width equal to the FWHM of the photoreceiver’s impulse response. For pulses of period T, then, the average power at saturation will be Pcw scaled by the duty cycle of the output signal, FWHM/T. For example, a 1-mW, 10-MHz laser used with a 10-GHz photoreceiver (35-ps FWHM) with Pcw = 1 mW would need to be attenuated by a factor of 35x10-12/100x10–9 or 35 dB.

A second consideration of pulsed-laser measurements is offsets. Offsets might result from the oscilloscope or a DC-coupled photoreceiver and can lead to erroneous conclusions about low frequency or slow signal components. For this reason, it is important to subtract offsets from the impulse measurement, which can be accomplished by subtracting the average background signal level taken over some window prior to pulse arrival from the entire measured impulse.

How Instrument Bandwidths Affect Your Measurements

To maintain the fidelity of your measurements, every component in your system needs to have a bandwidth greater than the 3-dB bandwidth of your signal, or, equivalently, an impulse response faster than the fastest part of your signal. (For time-domain measurements, a good rule of thumb is to have a frequency 3-dB bandwidth greater than 0.44/t, where t is the full width at half maximum (FWHM) of the temporal pulse). For example, even a very fast (50-GHz) oscilloscope combined with a 6-ps photodetector will not produce a 6-ps trace. This is because the pulse width you see depends on the convolution of many bandwidths, including those of the signal, the photodiode, and the oscilloscope.

To estimate the FWHM of a 5-ps pulse with a 6-ps photodetector and 50-GHz oscilloscope, you can sum the squares of the individual pulse responses. (This is very accurate for Gaussian pulses.) To do this, you will need to estimate the FWHM of the oscilloscope. Since FWHM≈0.44/f3-dB, where f3-dB is the frequency 3-dB bandwidth, we can estimate the FWHM for a 50-GHz oscilloscope as approximately 9 ps.1 The measured signal will then have a FWHM of 5 ps.

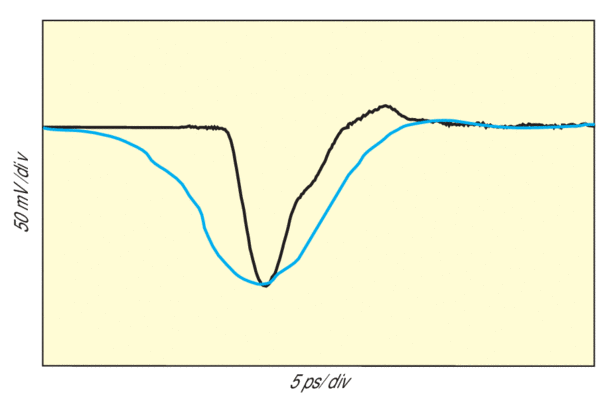
graph of the electro-optically sampled output of the photodiode with a 5-ps FWHM
The electro-optically sampled output of the photodiode with a 5-ps FWHM. The same output measured with a 50-GHz scope had a 12-ps FWHM.

Other important factors to keep in mind are the bandwidths of your cables and connectors, and the pulse-to-pulse jitter of your laser. Because the sampled oscilloscope trace is made up of data taken from many different pulses, timing jitter can broaden the measured signal.

graph of the electro-optically sampled output of the photodiode with a 5-ps FWHM

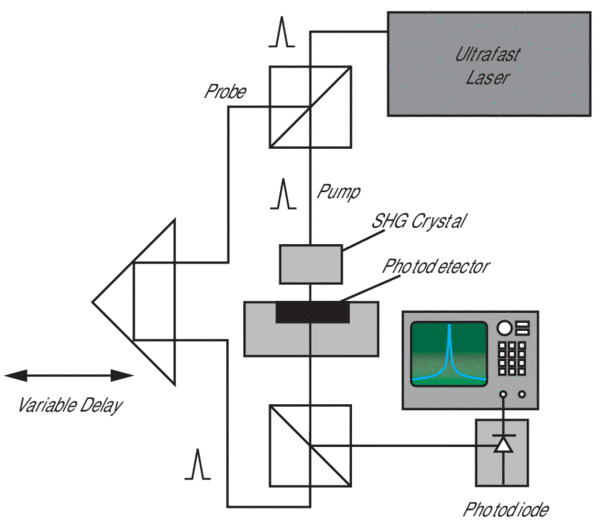
To measure signals greater than 50 GHz, you can use methods that are based on optical pump-probe configurations such as electro-optic sampling.2 By using electro-optic sampling and exciting the photodetector with a 100-fs FWHM pulse, we measured a response of 5-ps FWHM from a 60-GHz photodetector. By using a 50-GHz oscilloscope to measure the photodetector’s output with the same excitation pulse, the pulse width was 12 ps, as expected.

diagram of a typical pump-probe configuration as shown can have measurement bandwidths of a few terahertz
A typical pump-probe configuration as shown can have measurement bandwidths of a few terahertz.

Testing the Frequency and Pulse Response of Our High-Speed Photodetectors

Testing in the Frequency Domain

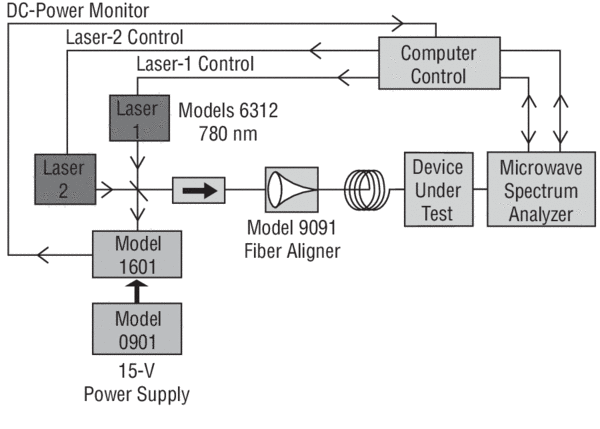
For speeds >20 GHz, we measure the photodetector’s frequency response by monitoring the beat signal generated from a heterodyne configuration where two laser beams of equal power and slightly different frequencies illuminate the photodetector. Because the photodetector is sensitive only to the input intensity and not to the electric field (a square-law response), it mixes the two laser beams and generates a photocurrent that contains a signal component at the beat note (difference frequency).3

To test our GaAs photodetectors, we use two of our 780-nm external-cavity tunable diode lasers; to test our InGaAs photodetectors, we use two tunable Nd:YAG lasers. Since these lasers are continuously tunable, any difference frequency from DC to greater than 90 GHz can be generated. We illuminate the photodetector with the two laser beams slightly detuned from each other and measure the photodetector’s output with a scalar analyzer up to 40 GHz (measurement accuracy ±1.5 dB) and a spectrum analyzer from 40 to 90 GHz (measurement accuracy ±3.5 dB).

Testing in the Time Domain

Each of our time-domain-optimized photodetectors and 12-GHz photoreceivers is individually tested and shipped with its own impulse-response curve recorded with a 50-GHz digital oscilloscope. The excitation pulse is provided by a 1550-nm pulsed fiber laser, and this is frequency doubled to 775 nm for our GaAs-based products. Its output has a <500-fs FWHM pulse duration.

Two New Focus™ external-cavity diode lasers at 780 nm are used to generate a heterodyne beat note from DC to greater than 60 GHz
Two New Focus™ external-cavity diode lasers at 780 nm are used to generate a heterodyne beat note from DC to greater than 60 GHz.

K. Rush, S. Draving, and J. Kerley, “Characterizing High-Speed Oscilloscopes,” IEEE Spectrum, (1990), pp. 38–39.
For a discussion on electro-optic sampling, see K.J. Weingarten, M.J.W. Rodwell, and D.M. Bloom, “Picosecond Optical Sampling of GaAs Integrated Circuits,” IEEE Journal of Quantum Electronics, QE-24 (1988), pp. 198–220.
R.T. Hawkins II, et al., “Comparison of Fast Photodetector Response Measurements by Optical Heterodyne and Pulse Response Techniques,” Journal of Lightwave Technology 9, No. 10 (10 Oct 1991), pp. 1289–1294.